HOUSE_OVERSIGHT_020824_sub_002 - HOUSE_OVERSIGHT_021023
Document Information
Bates Range
HOUSE_OVERSIGHT_020824_sub_002 - HOUSE_OVERSIGHT_021023
Pages
100
Source
House Oversight Committee
Original Filename
USA_Inc.pdf
Document Content
Page 101 - HOUSE_OVERSIGHT_020924
Effective Interest Rates: But Cost of Debt Unlikely to Continue to Decline For Extended Period If Economy Improves USA Federal Debt Weighted Average Yields, 1980 — 2010 30-Year Average Yield Weighted Average Treasury Yields (%) 0% . T T T T T T T T T T 1980 1983 1986 1989 1992 1995 1998 2001 2004 2007 2010 KP Source: US Treasury. i USA Inc. | Income Statement Drilldown 165 Effective Interest Rates: If Debt Levels & Interest Rates Rise Dramatically Beyond 2010, Net Interest Payments Could Soar... USA Federal Net Debt Outstanding / Effective Interest Rates / Net Interest Payments, 2009 — 2016E 11-16E 2009 2010 2011E 2012E 2013E 2014E 2015E 2016E CAGR Net Debt Outstanding ($B) $7,545 $9,019 $10,856 $11,881 $12,784 $13,562 $14,301 $15,064 7% Y/Y Growth 30% 20% 20% 9% 8% 6% 5% 5% Effective Interest Rate (%) 2.5% 2.2% 1.9% 2.0% 2.5% 3.1% 3.5% 3.7% - Net Interest Payments ($B) Y/Y Growth % of Federal Tax Receipts KP Note: CAGR is compound annual growth rate. Source: White House Office of Management and Budget. (@E) www.kpcb.com USA Inc. | Income Statement Drilldown 166 HOUSE_OVERSIGHT_020924
Page 102 - HOUSE_OVERSIGHT_020925
Effective Interest Rates: If Debt Levels & Interest Rates Rise Dramatically Beyond 2010, Net Interest Payments Could Soar USA Net Federal Debt Outstanding & As Percent of Total Revenue, 1980 — 2016E 1980 1983 1986 1989 1992 1995 1998 2001 2004 2007 2010 2013E 2016E BG, ms ee em er — res ee se ea — ses es ca er — pees es ne aS es i 3 aS Soe — aS HS Soe aes eS Sl fk soe Ae 30% am Net Interest Payment ($B) $500 ISIS cs 5 mks ce 9 ms es Ts Hs Ses ect — saa Les ces ot — ee 5 ——As % of Total Revenue 24% g g SE BAGG 2 tes ws ces — ces cate was ten — tee cas mts — ee es ls Hee ts en St — es ik ts — ti af ts = Pi 5 y = > e cw (CI S01 8 a Ree ieee = . 3 a g 12% @ foes | 3 $200 eA ac ce ma — esr cts oa es — as = | il Mena! > Sa i i + 3s 2 ” C4 6% $100 | BREET EEE ‘ie ] $ ] T T T T T T T T T T T 0% KP Note: CAGR is compound annual growth rate. Source: White House Office of Management and Budget. (@)E) www.kpcb.com USA Inc. | Income Statement Drilldown 167 Rising Debt Periodic Large Level & Interest One-Time Payments Charges Entitlement Spending Debt Composition Note: *denotes F2010 net income / net loss of respective programs, data per White House OMB. 1) Medicare and Social Security net loss excludes Trust Fund interest income. 2) TARP net loss includes proceeds from sale of warrants. TARP is Troubled Asset Relief Program; ARRA KP is American Recovery & Reinvestment Act programs. (@E) www.kpcb.com USA Inc. | Income Statement Drilldown 168 HOUSE_OVERSIGHT_020925
Page 103 - HOUSE_OVERSIGHT_020926
Debt Composition: Average Debt Maturity Declining Since 2000, Combined With Declining Interest Rate, Leading to “Artificially Low” Interest Payments USA Inc. Debt Maturity vs. Short-Term Interest Rate, 1980 — 2010 ee 20% a iy! Average Treasury Securities Maturity ro fo] 2 1 ih! =— = Short-Term Interest Rate > A * = 2 | 5° gleeeahtadieeesienttehteieatentieaeetemieaieenieiaaiaaees, dake ¥7 sate aeons 15% & E i! f 30-Year Average » 5 s ) | Maturity S a [ag wv ” = 2 F 5 10% = e 4 a E g 5 i m yy w@_ NJ _______.__ 2 ip me gm RQ = 2 4 ‘7 ia | rN SB & Vv / 5 \ \ a =a 7 1 3 T T T T T T T T T T = = 0% 1980 1983 1986 1989 1992 1995 1998 2001 2004 2007 Source: Dept. of Treasury. (@)E) www.kpcb.com USA Inc. | Income Statement Drilldown 169 Debt Composition: Maturity — Temporary High Mix (32%) of Short-Term Treasury Bills in 2009 Took Advantage of Historic Low Interest Rates to Reduce Interest Payments USA Inc. Outstanding Debt Breakdown by Type & Maturity, 2000 - 2010 i+) a a 100% T% aTIPS a Bonds Treasury Inflation 6% Protected Securities 5% - Long-Term (10+ Year Maturity) 4% a Notes - Medium-Term (2- 10 Year Maturity) 3% =a Bills 2% - Short-Term (0-1 sy | = ‘i Year Maturity) 1% Short-Term Interest Rate (Fed Funds Rate) 0% emails : % — = 2000 2001 2002 2003 2004 2005 2006 2007 2008 2009 2010 10-Year Average Share of T-Bills Interest Rate (%) % of Total Marketable Debt Outstanding P Note: Data as of March each year, composition excludes nonmarketable securities. Source: Dept. of Treasury. (@E) www.kpcb.com USA Inc. | Income Statement Drilldown 170 HOUSE_OVERSIGHT_020926
Sponsored
Page 104 - HOUSE_OVERSIGHT_020927
Debt Composition: Foreign Investors & Governments Hold ~46% of USA Inc. Public Debt 1989 Total Public Debt 2010 Total Public Debt Outstanding Outstanding $2 Trillion $9 Trillion u Foreign Investors & Government = Federal Reserve = Mutual Funds a State & Local Governments = Private Pension Funds a Depository Institutions = Insurance Companies a Other Investors Note: Public debt ownership excludes Government Accounts Series (such as Social Security Trust Fund) as those holdings KP are intra-government and not tradable in public. Source: Dept. of Treasury, as of CQ2:10. www.kpcb.com nc. | Income Statement Drilldown B kpeb USA Ine. | | $s Drilld 171 Debt Composition: Foreign Investors & Governments Hold 46% of USA Inc. Public Debt, Up From 4% in 1970 — How Much Higher Should It Go? Foreign Ownership of US Treasury Securities, CQ1:1970 — CQ2:2010 BGG wc - mee eo a a me en ns nS EE A I TO mE Top Foreign Owners, CQ2:10 China 10% = 40% Japan 9% ~~ fe wo a UK 3% 2) & Oil Exporters* 3% 2 oe I , w Brazil 2% - 2 All Other 18% BP 20% ~~ n= = ee ee lg = ae ee ae ee ee ae fre ne ee eee ee ee eee C7) 5 Oo ¢ a D 10% fn ° Le 0% 1970 1975 1980 1985 1990 1995 2000 2005 2010 Note: *Oil exporters include Ecuador, Venezuela, Indonesia, Bahrain, Iran, lraq, Kuwait, Oman, Qatar, Saudi Arabia, the United Arab Emirates, Algeria, Gabon, Libya, and Nigeria. KP Source: Dept. of Treasury, as of CQ2:10. (@E) www.kpcb.com USA Inc. | Income Statement Drilldown 172 HOUSE_OVERSIGHT_020927
Page 105 - HOUSE_OVERSIGHT_020928
And — You Guessed It — Here’s the Punch Line... By USA Inc.'s Own Forecast... CB www.kpcb.com USA Inc. | Income Statement Drilldown 173 Entitlement Spending + Interest Payments Alone Should Exceed USA Inc. Total Revenue by 2025E! Entitlement Spending + Interest Payments vs. Revenue as % of GDP, 1980 — 2050E —— Revenue 30% - ~c—Entitlement Spending + Net Interest Payments Total Revenue & Entitlement + Net Interest Payments as % of GDP NO o s 0% . T T T T T T T T T T T T T 1980 1990 2000 2010E 2020E 2030E 2040E 2050E Source: Congressional Budget Office (CBO) Long-Term Budget Outlook (6/10). Note that entitlement spending includes federal government expenditures on Social Security, Medicare and Medicaid. Data in our chart is based on CBO’s ‘alternative fiscal scenario’ forecast, which assumes a continuation of today’s underlying fiscal policy. Note that CBO also maintains an ‘extended-baseline’ scenario, which adheres closely to current law. The alternative fiscal scenario deviates from CBO’s baseline because it incorporates some policy changes that are widely expected to occur (such as extending the 2001-2003 tax cuts rather than letting them expire as scheduled by current law and adjusting physician payment rates to be in line with the Medicare economic index rather than at lower scheduled rates) and KP that policymakers have regularly made in the past. (@E) www.kpcb.com USA Inc. | Income Statement Drilldown 174 HOUSE_OVERSIGHT_020928
Page 106 - HOUSE_OVERSIGHT_020929
CBO’s Projection from 10 Years Ago (in 1999) Showed Federal Revenue Sufficient to Support Entitlement Spending + Interest Payments Until 2060E — 35 Years Later than Current Projection CBO’s Projection in the ‘1999 Long-Term Budget Outlook’ on Entitlement Spending + Interest Payments vs. Revenue as % of GDP, 1980 — 2070E —— Revenue —o— Entitlement Spending + Net Interest Payments Total Revenue & Entitlement + Net Interest Payments as % of GDP NO o s 0% | 1980 1990 2000 2010E 2020E 2030E 2040E 2050E 2060E 2070E Source: Congressional Budget Office Long-Term Budget Outlook (1999). KP Note that there was no alternative fiscal scenario in CBO’s forecast back then. (@)E) www.kpcb.com USA Inc. | Income Statement Drilldown 175 If the Previous Two Slides... arenta wake-up call, we don't know what Is... | (@E) www.kpcb.com USA Inc. | Income Statement Drilldown 176 HOUSE_OVERSIGHT_020929
Sponsored
Page 107 - HOUSE_OVERSIGHT_020930
Drill Down on USA Inc. Periodic Large One-Time Charges Rising Debt Periodic Large Level & Interest One-Time Payments Charges Entitlement Spending Note: *denotes F2010 net income / net loss of respective programs, data per White House OMB. 1) Medicare and Social Security net loss excludes Trust Fund interest income. 2) TARP net loss includes proceeds from sale of warrants. TARP is KP Troubled Asset Relief Program; ARRA is American Recovery & Reinvestment Act programs. (@)E) www.kpcb.com USA Inc. | Income Statement Drilldown 177 One-Time Charges: Unusually High in F2009 & F2010 with Financial + Economic Crisis | F2011 Net Sum of Net One-Time Charges to USA Inc. ($B) F2008 F2009 F2010 YTD* 4 Years Government-Sponsored Enterprises (GSEs) $14 $97 $41 _ $152 Fannie Mae -- 60 23 -- 83 Freddie Mac $14 37 18 — 69 Troubled Asset Relief Program (TARP)* - $261 -$26 -$23 $213 Banks -- 134 -85 -28 21 Automakers -- 78 -6 -14 58 AIG -- 49 -- 20 69 Individual Homeowners -- 0 39 -1 38 Other Financial Institutions -- - 22 - 22 Consumers & Small Businesses -- - 4 - 4 American Recovery and Reinvestment Act (ARRA)** - $40 $137 - $177 Education -- 21 50 -- 71 Nutrition Assistance -- 5 11 -- 16 Transportation -- 4 15 -- 19 Tax Credits -- 2 33 -- 35 Energy - 1 5 -- 6 Other — 7 23 - 30 Net Total One-Time Charges ($B) $14 | $398 $152 -$23 $542 Note: Federal fiscal year ends in September. *TARP one-time charges include repayments & dividends; F2011 TARP data as of 2/11, per US Treasury; F2011 YTD GSE & ARRA data not available. **ARRA one-time charges exclude funds used by entitlement programs such as Social Security / Medicare / KP Medicaid / Unemployment. Source: Congressional Budget Office, Dept of Treasury. (@E) www.kpcb.com USA Inc. | Income Statement Drilldown 178 HOUSE_OVERSIGHT_020930
Page 108 - HOUSE_OVERSIGHT_020931
One-Time Charges: What Charges from F2008-F2010 May Look Like on Net Basis Over Next 10 Years One-Time Charges from the ‘Financial Crisis’ are Not Created Equal — While TARP Was the Headliner, When All’s Said & Done, TARP may be Smallest Component, by a Long Shot Current Cost |Ultimate Cash Cost ($B, as of 2/11) ($B, by F2020E) |Comments May fall from net $213 billion to $51 billion or less! as banks continue to pay back their loans and automakers / AIG seek IPOs / sales to realize value of USA Inc.’s equity stake. May grow from net $152 billion to ~$160 billion (or higher)? as Fannie Mae and Freddie Mac losses on loan guarantees stabilize and they continue to pay dividends on USA Inc.’s shares. TARP $213B — —|— > <$51B' GSE $152 Should rise from $177 billion to $417 billion’ ARRA $177 ——|— > $417 based on commitments...and a payback plan was never factored into these payments. Note: 1) Latest Treasury estimate as of 12/10, includes net profits from banks of $16B, net costs from AIG ($5B) / Automakers ($17B) / Consumers & Housing programs ($-46B) and other. AIG net costs excludes potential gains from selling AIG’s common shares held by the Treasury, which could turn out to be a $22B profit for the Treasury based on 10/1/10 closing price. Including this potential gain, TARP ultimate cost to the Treasury would be $29B. 2) White House OMB estimates ultimate cash cost of Fannie Mae / Freddie Mac at $165B while the CBO estimates the ultimate cash costs at $160B. Both estimates imply an average default rate of 5-10% on Fannie Mae + Freddie Mac’s $5T loan guarantee portfolio and a loss severity of 50%. The Federal Housing Finance Agency (FHFA) estimates ultimate costs to range from $142B to $259B. 3) Net cash costs are limited to discretionary spending items in ARRA. Source: CBO, U.S. Dept of Treasury, White House OMB, FHFA. (@)E) www.kpcb.com USA Inc. | Income Statement Drilldown 179 Recipients of $ from USA One-Time Charges (F2008-2011YTD) Total Net 2008-2011 One-Time Charges = $542 Billion (as of 2/11) Other Transportation + Energy + Other Consumers Homeowners + Consumers & Small Businesses + Education + Nutrition + Tax Banks 700 Banks received funds, 100 repaid so far credits Automakers Insurers / Other Government- Financial Institutions Sponsored in ter Financial Enterprises ASUS Fannie Mae + Freddie Mac KP Source: Dept. of Treasury, as of 2/11. a USA Inc. | Income Statement Drilldown 180 HOUSE_OVERSIGHT_020931
Page 109 - HOUSE_OVERSIGHT_020932
Drill Down on One-Time Charges Most of USA Inc.’s recent one-time charges are directly or indirectly related to America’s real estate bubble and aggressive borrowing. First we look at the drivers of the real estate bubble (we call it ‘anatomy of a real estate bubble’), then we drill down on the past / present / future financial impact of the three types of one-time charges and the recipients: 1) TARP (Troubled Asset Relief Program) 2) GSEs (Government-Sponsored Enterprises) 2) ARRA (American Recovery and Reinvestment Act) KP i USA Inc. | Income Statement Drilldown 181 What created the real estate bubble? KP FSA sa erpce.com USA Inc. | Income Statement Drilldown 182 HOUSE_OVERSIGHT_020932
Sponsored
Page 110 - HOUSE_OVERSIGHT_020933
Real Estate Bubble: Root Causes—Government Home Ownership Push + Declining Interest & Savings Rates + Aggressive Borrowing and Lending Led to 10+ Years of Rising Home Ownership USA Home Ownership Rates vs. Interest Rates vs. Personal Savings Rates, 1965 - 2010 0, _ i 0, 70% June 2004: US home ownership = 73MM 20% 68% ~ + 16% = fa ro) £ 66% | January 1993: HUD began promoting & cL broader home ownership. US home a a ownership = 62MM L 0, o o 12% - s < 2 5 g 2 & 4h a 8 w £ 2 2 | 8% = (4 ‘ ~ a 3 5 62% 5 > = 6 =] + 4% 60% 58% 1 1 1 1 + + ; ; ; ~~ 0% 1965 1968 1971 1974 1977 1980 1983 1986 1989 1992 1995 1998 2001 2004 2007 2010 ——U.S. Home Ownership Rate U.S. Interest Rate «="PU.S. Home Ownership Rate 30-year (1965-1995) Trendline —— U.S. Personal Savings Rate Note: HUD is Dept. of Housing & Urban Development. interest rate is the overnight federal funds rate. Data as of CQ1:10. Savings rate is amount of saving divided by income after taxes. KP Data source: Federal Reserve, DOC Bureau of Economic Analysis. (@E www.kpcb.com USA Inc. | Income Statement Drilldown 183 Real Estate Bubble: Home Prices Rose Dramatically (7% Annually) for 10 Years — Up ~2x Over 10-Year Period Ending 2007 USA Real Home Price & Building Cost Indexes, % Change 1965 — 2008 —— USA Real Home Price Index —— USA Real Building Cost Index % Change from 1965 Level 1965 1968 1971 1974 1977 1980 1983 1986 1989 1992 1995 1998 2001 2004 2007 Note: Real home prices & building costs are inflation-adjusted. Source: Robert Shiller, Yale University. Ce USA Inc. | Income Statement Drilldown 184 HOUSE_OVERSIGHT_020933
Page 111 - HOUSE_OVERSIGHT_020934
Banks & Other Mortgage Originators Helped Fuel Housing Bubble as They Originated Lower Quality Mortgages — Alt-A & Subprime Origination Volumes Up 374% & 94% in 2006 vs. 2003 USA Residential Mortgage Origination by Product Type, 2001 — 2010 4,000 ~~~ ~~ ~~ nn 50% _ sg ° te) o 45% a & ° c F 40% x & 3000 -------------- ee een Ss sas seas a cs ees es = te ees Ses a ee 4 g J 35% x = 2 5 J 30% < wo > 2,000 - cum 6 fam er AMGa 2 m2 cen com mum mem sam gum a m8 eee 25% = 2 a ° 20% y = & s 15% = § 1,000 -- meg ---- i - - - Ge - - - RR - - - - - ---- + . 10% g v = cw 5% & g a 2 0: 1 0% 2001 2002 2003 2004 2005 2006 2007 2008 2009 2010 ==) Conventional “as: Jumbo mam Subprime mm Alt-A mam Home Equity “as FHA/VA =—— Total Non-Conventional as % of Total KP Source: Inside Mortgage Finance. i USA Inc. | Income Statement Drilldown 185 Real Estate Bubble: Investors Helped Fuel It, Too, as They Reached For Yield Without Questioning AAA Ratings of A Subprime-Backed Investments Investors picked up 25-35bps over U.S. Treasuries with comparable maturity, typically levered 10:1 and generated 2.5-3.5% yield, meaningful against an 8% annual yield target Illustrative AAA-Rated Subprime RMBS Yield Spread* with 10x Leverage, 2/05 — 2/07 4.0% 3.6% 3.2% 2.8% 2.4% Subprime RMBS Yield Spread vs. 7-Year Swap Rate 2.0% i T T T T T T T T T T T 2/05 4/05 6/05 8/05 10/05 12/05 2/06 4/06 6/06 8/06 10/06 12/06 Note: Illustrative AAA-rated subprime RMBS spread represented as Mezzanine CDO spread vs. 7-year swap rate. KP Source: Betsy Graseck, Morgan Stanley Research. (@E) www.kpcb.com USA Inc. | Income Statement Drilldown 186 HOUSE_OVERSIGHT_020934
Page 112 - HOUSE_OVERSIGHT_020935
Investors Struggle with Today’s Low ~4% Risk Free Rate ¢ Pension funds & other investors look for ~8% annual returns in order to meet promised payouts. ¢ The challenge is far greater than before given: - Rising obligations relative to income - Lower interest rates ¢ Promises (e.g., pension, healthcare) made during an 8% interest rate environment are much harder to meet when the risk free rate has fallen from 8% to 3.6%. ' ¢ The choice is either to reduce obligations... or ...INvest in riskier assets. Note: 10-year Treasury coupon rate as of 2/18/2010. Source: Betsy Graseck, Morgan Stanley Research. i USA Inc. | Income Statement Drilldown 187 Rising Debt Periodic Large Level & Interest One-Time Payments Charges Entitlement Spending ($26B Net Profit*?) Note: *denotes F2010 net income / net loss of respective programs, data per White House OMB. 1) Medicare and Social Security net loss excludes Trust Fund interest income. 2) TARP net loss includes proceeds from sale of warrants. TARP is Troubled Asset Relief Program; ARRA KP is American Recovery & Reinvestment Act programs. (@E) www.kpcb.com USA Inc. | Income Statement Drilldown 188 HOUSE_OVERSIGHT_020935
Sponsored
Page 113 - HOUSE_OVERSIGHT_020936
Troubled Asset Relief Program (TARP): Recipient of 38% of Net Government (Taxpayer) Funding” In TARP, the financial rescue program (created in October, 2008), USA Inc. purchased assets and equity from financial institutions to provide the capital and liquidity needed during the 2008 financial crisis (which followed the real estate bubble). In 2009, TARP recipients were broadened to include automakers, an insurance company (AIG), individual homeowners, small & medium- sized businesses and other non-bank financial institutions. To date, USA Inc. loaned these institutions $464 billion and received $250 billion in repayment and warrant proceeds for a net outstanding loan balance of $214 billion. Note: *As of 2/11, numbers are rounded. Source: Dept. of Treasury. (@)E) www.kpcb.com USA Inc. | Income Statement Drilldown 189 TARP Distribution — Equally Distributed Among Financial Institutions / Automakers / Insurer / Individuals as of 2/11 Outstanding Troubled Asset Relief Program (TARP) Balance of $214B' as of 2/11 Individuals Company S rs & lesses4 Auto rs° Financial Companies Institutions SunTrust Banks - $5B Regions Financial - $3.5B Note: 1) #s are rounded, includes warrant proceeds of $10B from banks. 2) Total principal + accrued interest on AIG preferred stock purchased by U.S. Treasury prior to 1/11 = $49B, on 1/14/11, AIG drew an additional $20B TARP funding to buy out Federal Reserve’s investment. 3) Including banks and other financial institutions; done via Public-Private Investment Program (PPIP) under which Treasury provides equity and debt financing to newly formed public-private investment funds (PPIFs) established by fund managers with investors for the purpose of purchasing legacy securities from financial institutions. These securities are commercial mortgage- backed securities and non-agency residential mortgage-backed securities. 4) Consumers and small & medium-sized businesses that need loans would benefit from the Term Asset-Backed Securities Loan Facility (TALF), through which the Fed provides loans to help support the issuance of asset-backed securities (which would in turn fund a substantial portion of the consumer credit and small business loans). Source: Dept. of Treasury, AIG, data as of 2/14/10. KP a USA Inc. | Income Statement Drilldown 190 HOUSE_OVERSIGHT_020936
Page 114 - HOUSE_OVERSIGHT_020937
TARP Repayments and Outstanding Loans: Most Large Banks Have Repaid $222 Billion Paid Back’, $23 Billion Outstanding TARP Repayments: Top 8 Bank of America Citigroup* Warrant & ‘Other | Proceeds Wells Fargo JPMorgan Goldman Sachs Morgan Stanley PNC Financial US Bank $20 $30 $40 $50 $60 SunTrust Regions Financial Key Corp. CIT Group** Marshall & Ilsley Zions Synovus Popular TARP Outstanding: Top 8 $- $10 $20 $30 $40 $50 $60 Note: 7) Includes warrant proceeds from banks; *Citigroup’s repayments include $2.3B repayment on the Asset Guarantee program and $6.9B additional proceeds from selling Treasury’s ownership. **Treasury’s preferred stock investment in CIT Group (@)E) www.kpcb.com was lost as a result of CIT’s bankruptcy filing. Source: Dept of Treasury, data as of 2/117. USA Inc. | Income Statement Drilldown 191 TARP Repayments And Outstanding Loans: Most Non-Bank TARP Recipients Have Not Repaid $27 Billion Paid Back, $171 Billion Outstanding TARP Repayments General Motors Chrysler Chrysler Financial $- $20 $40 $60 General Motors PPIP* GMAC Chrysler TALF* GM Suppliers Chrysler Suppliers FHA* TARP Outstanding AIG $60 wn 1 $20 $40 Note: * PPIP is Public-Private Investment Program, FHA represents the FHA Short Refinance Program, TALF is Term Asset- (@E) www.kpcb.com Backed Securities Loan Facility. Source: Dept of Treasury, data as of 1/11. USA Inc. | Income Statement Drilldown 192 HOUSE_OVERSIGHT_020937
Page 115 - HOUSE_OVERSIGHT_020938
Rising Debt Periodic Large Level & Interest One-Time Payments Charges Entitlement Spending Fannie Mae/ (-$41 B Net Loss*) Note: *denotes F2010 net income / net loss of respective programs, data per White House OMB. 1) Medicare and Social Security net loss excludes Trust Fund interest income. 2) TARP net loss includes proceeds from sale of warrants. TARP is Troubled Asset Relief Program; ARRA KP is American Recovery & Reinvestment Act programs. (@)E) www.kpcb.com USA Inc. | Income Statement Drilldown 193 Government-Sponsored Enterprises (GSEs): Recipients of 28% of Net Government (Taxpayer) Funding e GSEs Fannie Mae & Freddie Mac extended their guarantees on residential mortgages from conventional loans into Alt-A, interest-only and subprime loans. While technically not part of the federal government, Fannie Mae & Freddie Mac have enjoyed an implicit government guarantee on their debt and RMBS securities as investors believed (correctly, as it turned out) that the federal government would support these entities if they failed. As a result, GSEs’ long- term debt securities receive AAA/Aaa ratings from all rating agencies and are classified by financial markets as “agency securities” with interest rates above USA Treasuries but below AAA corporate debts. Post placing Fannie Mae & Freddie Mac into a government conservatorship, USA Inc. has so far invested $152B' into these two GSEs with an estimated $8- 13B2 more likely over the next 10 years, given the ongoing weakness in housing market and the poor underwriting by Fannie Mae & Freddie Mac. Source: 1) U.S. Dept of Treasury, as of 12/10, 2) White House OMB / U.S. Congressional Budget Office. a USA Inc. | Income Statement Drilldown 194 HOUSE_OVERSIGHT_020938
Sponsored
Page 116 - HOUSE_OVERSIGHT_020939
Fannie Mae & Freddie Mac: A Brief History of Government-Sponsored Enterprises Freddie Mac established in Fannie Mae and Freddie Mac ; ; ; 1970 after the Emergency placed into conservatorship Fannie Mae established in Home Finance Act to at a time when they 1938 to provide liquidity to provide further liquidity to guaranteed 57% of the $12 the primary and secondary the mortgage markets trillion USA mortgage market mortgage markets Fannie Mae became a publicly traded company in Freddie Mac became a 9/68, in part to reduce rising government debt publicly traded company in levels from the Vietnam War by taking Fannie Mae 12/88 with an initial market debt off USA Inc.’s balance sheet cap of $3 billion Fannie Mae & Freddie Mac — What do they do? They are insurance and investment companies. Both buy residential and multifamily mortgages which conform to their underwriting standards from banks and other originators. They either hold them in their portfolios or package them into residential mortgage-backed securities (RMBS). These securities, which carry Fannie and Freddie’s guarantee on them, are then sold to investors (banks, insurance companies, bond funds, etc.). K P Source: Fannie Mae, Freddie Mac, Los Angeles Times. (@)E) www.kpcb.com USA Inc. | Income Statement Drilldown 195 Fannie Mae & Freddie Mac: What Went Wrong? Fannie Mae and Freddie Mac Public Market Capitalizations, 1990 — 2010 7/05 — Fannie Mae and Freddie BETIS mom = mors ne cm ne tc cer 9 eg eae te te em em Mac agreedtorestrictionson | growth of their retained portfolios 9/08 — Fannie B80 FN Mae and Freddie 9/99 — Fannie Mae expanded mortgage | Mac placed into availability to low-income borrowers conservatorship under pressure from White House 1/93 - HUD began promoting broader $40 — home ownership == Market Cap ($B) $20 ---------_ ff 8 $0 . T T T T T T T T T T 1990 1992 1994 1996 1998 2000 2002 2004 2006 2008 2010 —— Freddie Mac — Fannie Mae Note: HUD is Department of Housing and Urban Development. Source: FactSet. a USA Inc. | Income Statement Drilldown 196 HOUSE_OVERSIGHT_020939
Page 117 - HOUSE_OVERSIGHT_020940
Fannie Mae & Freddie Mac: Accounted for Majority of Total Residential Mortgage-Backed Securities (RMBS) Issuance Since 1990s Fannie Mae / Freddie Mac Residential Mortgage-Backed Securities Issuance and as % of Total Market Volume, 1998-2010 ANI mo cnn ss commun x rem 2 I 2 A RB AB IRS SUT SEGA THRE YH 7 URN 80% 1800 N 72% < 0 = mag I on ne a 64% £ roby , a £ iS 2 3 4,400 ----------------+ +222 22-2222 Af eee eee eee eee - 56% S$ . 2 & 1,200 ------------ +2222 ee ee eee eee ee eee eee - 48% 5 5 = OD 1.000 f .. 49% @ & 1,000 40% m 3 = BE BOO, = = enn w= mn en we ns ene en a nn 32% 8 =) ° by Ee oe - 24% s x : oe oo oe lee | 16% 2 = ail if fall TH} 7 oa i i 1 0% 1988 1992 1996 2000 “a Fannie Mae RMBS Mai Freddie Mac RMBS ——Fannie + Freddie RMBS as % Total RMBS Sources: 1988-2006 data from Calculated Risk; Fannie Mae / Freddie Mac data from FHFA Annual Report to the KP Congress 2009, 2009 / 2010 data per EMBS and Hybrid Weekly. (@)E) www.kpcb.com USA Inc. | Income Statement Drilldown 197 Fannie Mae & Freddie Mac: Latest Estimated Ultimate Cost to Taxpayers Varies* Base-Case Estimated Ultimate Source Comments / Assumptions Net Loss** Net accrued loss to be borne by taxpayers, including net cash infusions (with implied default rate of ~5- 10%) and risk premiums associated with federal Congressional government’s implicit guarantee on GSEs’ credit. $389 Billion Budget Office Bulk of the net loss ($291B) occurred prior to and (CBO) during F2009. On a cash basis, CBO’s estimate would have been in line with White House OMB’s estimate. Net cash outlay to be borne by Treasury Dept. (and ultimately taxpayers), including Treasury Dept.’s cash Wine: HeUSS outlays to purchase Fannie Mae & Freddie Mac $160 Billion pater and Preferred stock (with implied default rate of ~5-10%), Budget (OMB) minus cash received from dividends. Bulk of the net cash outlay ($112B) occurred prior to and during F2009. Note: *Latest estimated cost to taxpayers varies and continues to rise. **By F2019E. Source: CBO, OMB. (@E) www.kpcb.com USA Inc. | Income Statement Drilldown 198 HOUSE_OVERSIGHT_020940
Page 118 - HOUSE_OVERSIGHT_020941
Fannie Mae & Freddie Mac: Scenario Math — What Various Default Rates Could Mean for Taxpayer Ultimate Cash Cost Fannie Mae / Freddie Mac VY VY . Ultimate Cash Cost Outstanding Loan Guarantees| /\ Default Rate | LOSS Severity — to Taxpayer Outstanding | Default | Ultimate Cash Cost Loan Guarantees Rate Loss Severity* to Taxpayer 2% $50 Billion - $160 Billion 5% $125 Billion 4 eT $5 Trillion’ Ml i Ml ili || REN a OMB Forecasts (before 10% $250 Billion of Ultimate Cash conservatorship in 15% $375 Billion eae? EE Mac 9/08) | i 20% $500 Billion 25% $625 Billion i L L Note: * Loss severity is liquidation value (foreclosure auction or other means) as a % of the loan amount adjusted for any advances and fees. Source: 1) Fannie Mae, Freddie Mac. KP i USA Inc. | Income Statement Drilldown 199 : Rising Debt Periodic Large SUE TEIN Level & Interest One-Time S : pending Payments Charges Note: *denotes F2010 net income / net loss of respective programs, data per White House OMB. 1) Medicare and Social Security net loss excludes Trust Fund interest income. 2) TARP net loss includes proceeds from sale of warrants. TARP is Troubled Asset Relief Program; ARRA is American Recovery & Reinvestment Act programs. KP FSA sa erpce.com USA Inc. | Income Statement Drilldown 200 HOUSE_OVERSIGHT_020941
Sponsored
Page 119 - HOUSE_OVERSIGHT_020942
America Recovery & Reinvestment Act (ARRA): Recipient of 34% of Net Government (Taxpayer) Funding In ARRA (the economic stimulus program created in February, 2009), USA Inc. aims to create jobs and promote investment and consumer spending by cutting taxes, expanding unemployment benefits, and increasing spending in education, healthcare, infrastructure, and energy. These measures are projected to increase federal spending by $500+ billion while reducing federal tax receipts by $275 billion over 10 years ($177 billion of which occurred in F2009 and F2010). KP Source: White House Office of Management & Budget. (@)E) www.kpcb.com USA Inc. | Income Statement Drilldown 201 ARRA*: Negative Effect on Discretionary Budgets Should Peak in F2010, But Spending Commitments through F2019E Total $417 Billion ARRA* Discretionary Items’ Net Effect on Federal Budgets, F2009 — F2019E F2009 F2011E F2013E F2015E F2017E F2019E 0 20 s - Gee 8k 40 ll ee 60 -- 80 --- Wy mTaxCredits = --------- = Other ARRA Discretionary Items' Net Effect on Federal Budget ($B) Note: *ARRA is American Recovery and Reinvestment Act of 2009. US federal fiscal year ends in September. Net effects on KP budgets are limited to discretionary spending items in ARRA. Source: Congressional Budget Office. (@E) www.kpcb.com USA Inc. | Income Statement Drilldown 202 HOUSE_OVERSIGHT_020942
Page 120 - HOUSE_OVERSIGHT_020943
ARRA: Spending Examples Education — Used ARRA funding and saved education jobs, such as teachers, principals, librarians, and counselors Tax Credits — Provided higher Earned Income Tax Credits Transportation — Repaired roads and bridges Energy — Provided additional funding for renewable energy and energy efficiency projects Nutrition Assistance — Provided additional assistance for low-income families to purchase food Other — Funding for various programs related to homeland security and law enforcement... KP i USA Inc. | Income Statement Drilldown 203 Longer-term taxpayer impact of GSE Loans + ARRA + TARP varies...regardless, it is material | (@E) www.kpcb.com USA Inc. | Income Statement Drilldown 204 HOUSE_OVERSIGHT_020943
Page 121 - HOUSE_OVERSIGHT_020944
What ‘One-Time Charges’ from F2008-F2010 May Look Like on Net Basis Over Next 10 Years One-Time Charges from the ‘Financial Crisis’ are Not Created Equal — While TARP Was the Headliner, When All’s Said & Done, TARP may be Smallest Component, by a Long Shot Current Cost /|Ultimate Cash Cost ($B, as of 2/11) ($B, by F2020E) |Comments May fall from net $214 billion to $51 billion or less! as banks continue to pay back their loans and automakers / AIG seek IPOs / sales to realize value of USA Inc.’s equity stake. May grow from net $152 billion to ~$160 billion (or higher)? as Fannie Mae and Freddie Mac losses on loan guarantees stabilize and they continue to pay dividends on USA Inc.’s shares. TARP $214B — —|— > <$51B" GSE $152 — —|— > ~$160? Should rise from $177 billion to $417 billion? based on commitments...and a payback plan was never factored into these payments. ARRA $177 ——|— > $417 Note: 1) Latest Treasury estimate as of 12/10, includes net profits from banks of $16B, net costs from AIG ($5B) / Automakers ($17B) / Consumers & Housing programs ($-46B) and other. AIG net costs excludes potential gains from selling AIG’s common shares held by the Treasury, which could turn out to be a $22B profit for the Treasury based on 10/1/10 closing price. Including this potential gain, TARP ultimate cost to the Treasury would be $29B. 2) White House OMB estimates ultimate cash cost of Fannie Mae / Freddie Mac at $165B while the CBO estimates the ultimate cash costs at $160B. Both estimates imply an average default rate of 5-10% on Fannie Mae + Freddie Mac’s $5T loan guarantee portfolio and a loss severity of 50%. The Federal Housing Finance Agency (FHFA) estimates ultimate costs to range from $142B to $259B. 3) Net cash costs are limited to discretionary spending items in ARRA. Source: CBO, U.S. Dept of Treasury, White House OMB, FHFA. BSF owe noo com USA Inc. | Income Statement Drilldown 205 206 HOUSE_OVERSIGHT_020944
Sponsored
Page 122 - HOUSE_OVERSIGHT_020945
207 208 HOUSE_OVERSIGHT_020945
Page 123 - HOUSE_OVERSIGHT_020946
Balance Sheet Drilldown KP i USA Inc. | Balance Sheet Drilldown 209 Balance Sheet: USA Inc. Federal Debt + Unfunded Entitlement Liabilities (Social Security + Medicare...) Exceed Stated Assets F1996 -.. F2003. «.. F2009 F2010 Comments ASSETS ($B) Cash & Other Monetary Assets $193 $120 $393 $429 $200B cash balance owing to Accounts / Loans / Taxes Receivable 206 278 626 783 temporary Fed market stabilization Inventories 232 241 285 286 initiatives Property, Plant & Equipment 969 658 784 T Investments - - 254 Includes $145B TARP direct loans & Other assets 124 97 275 303 equity investment + $109B in GSEs Total Assets ($B) 1,724 1,394 2,668 2,884 Growth primarily owing to TARP Y/Y Growth 33% 40% 35% 8% _ capitalization + Fed liquidi rogram LIABILITIES ($B) Accounts Payable $162 $62 $73 Significant rise in debt owing to on- going budget deficits + stimulus spending Federal employee & veteran benefits rose 3x owing to scheduled annual pay raises + rising benefit costs Accrued Payroll & Benefits Liability to GSEs Other Liabilities Uni nt Lia Unfunded entitlement liabilities up 6x Y/Y Growth between F1996 and F2010. NPV of Unfunded Social Security . NPV of Unfunded Medicare 4,815 15,819 38,107 22.813 ‘Medicare NPV down sharply Y/Y owing to new assumptions from the Healthcare reform legislation Significant increase from rising levels of debt + unfunded future benefits $4 -$44T of net worth for USA Inc. more 8% -23% than tripled, from -$10T in 1996 Note: USA ine.’s balance sheet presented here does not include the financial value of the Government's sovereign powers to tax, regulate commerce, and set monetary policy. It also excludes its control over nonoperational resources, including national and natural resources, for which the Government is a steward. Total liabilities include the net present value (NPV) of unfunded entitlement liabilities like Social Security / Medicare / other payments, which the Treasury Dept. considers ‘off-balance sheet’ KP responsibilities. U.S. government fiscal year ends in September. Source: U.S. Department of the Treasury, Financial Report on the U.S. Government, 1996 — 2010. (@E) www.kpcb.com USA Inc. | Balance Sheet Drilldown 210 NPV of Unfunded Other Benefits 79 94 97 Lia e 3) Y/Y Growth NE’ Y/Y Growth HOUSE_OVERSIGHT_020946
Page 124 - HOUSE_OVERSIGHT_020947
USA Inc. Net Worth: -$44 Trillion in Perspective There are doubts about the accuracy of such a big negative number, especially when the value of USA Inc.’s assets is so hard to calculate. The value of natural resources, the power to tax, the ability to print the world’s reserve currency, the human capital in our educational system — these and other assets would clearly reduce that number, if they could be accurately calculated. Given the differences between government and corporate accounting, what matters is not the exact number, but the trend — which is clearly moving in the wrong direction. Liabilities have been growing faster than assets. Just to put that $57 trillion into context... -$44 Trillion = $142,999 per Person in USA' $370,961 per Household‘ 20x USA Inc. Annual Revenue? 3.8x S&P500 Total Market Capitalization? 3.0x USA Annual GDP* 0.9x Global Stock Market Capitalization@ 0.8x Total USA Household Wealth@ Source: 1) Population & household data as of 1/10, per Census Bureau estimates; 2) annual federal income in F2010, per Dept. of Treasury; 3) as of 1/11, per S&P; 4) GDP is 2010 nominal figure, per BEA; 5) as of 1/10, per World Federation of Exchanges; 6) as of CQ3:10, calculated as total net worth of households & KP nonprofit organizations, per Federal Reserve (12/10 data). CC —— USA Inc. | Balance Sheet Drilldown 211 We Believe Citizens Should Consider These ‘Off-Balance Sheet’ Liabilities For A ‘More Complete’ Understanding of USA Inc.’s Finances “...the Government’s responsibilities to make future payments for social insurance and certain other programs are not shown as liabilities according to Federal accounting standards... These programmatic commitments remain Federal responsibilities and as currently structured will have a Significant claim on budgetary resources in the future...The reader needs to understand these responsibilities to get a more complete understanding of the Government’s finances.” Department of the Treasury, “2004 Financial Report of the United States Government” KP Ce USA Inc. | Balance Sheet Drilldown 212 HOUSE_OVERSIGHT_020947
Sponsored
Page 125 - HOUSE_OVERSIGHT_020948
Balance Sheet: USA Inc. Total Liabilities*: $47 Trillion in F2010, or $395,093 per Household Owing Largely to Entitlement Spending Total Assets / Liabilities / Net Worth of USA Federal Government, Using Corporate GAAP Accounting, F1996-F2010 mm $10 & é $ i T T T T T T T T T T T T T T 1 z 230 C—A FT eee ease a8 z O ~~ @) 0 2 “$20 -- 32+ oe we cee eee eed oR. - cs ian 9 ian ra i - pee ie > 5 C) s “—_z ao -$30 --- . ay, ER cs eS wer man oo a a ; Ps mam Unfunded Entitlement Benefits cn) 2 $40 -—-- | ER on ~~ oe _ ra = i a mam Current Liabilities eee 5 5 6 O 6 $50 === er ee ER RD SE SE OS Su Sa me 0. a Sh E mami Total Assets O. 2 0} i= Nene es Se a -$60 —e—Net Worth Medicare liabilities down sharply owing to slower 2) healthcare cost growth assumptions associated 7 $70 fee with 2010 Healthcare reform == o im «° 2 2 = a se} x rrr} o — «° 7) i) o o ro7) 7) é ° ° ° ° ° ° ° ° ° = 7) 7) 2) a ° ° ° ° ° ° ° ° ° ° ° = = = = N N N N N N N N N re re re re ra ry re ra ry ry ry ry ry ry ry Note: USA inc.’s balance sheet presented here does not include the financial value of the Government's sovereign powers to tax, regulate commerce, and set monetary policy. It also excludes its control over nonoperational resources, including national and natural resources, for which the Government is a steward. Total liabilities include the net present value (NPV) of unfunded entitlement liabilities like Social Security / Medicare / other payments, which the Treasury Dept. considers ‘off-balance sheet’ responsibilities. U.S. government fiscal year ends in September. Source: U.S. Department of the Treasury, Financial Report on the US. KP Government, 1996 — 2009. (@)E) www.kpcb.com USA Inc. | Balance Sheet Drilldown 213 Balance Sheet: USA Inc. Total Liabilities: $47 Trillion in F2010 Up 5x From 1996, Driven by Medicare Liabilities Total Liabilities of USA Federal Government, Using Corporate GAAP Accounting, F1996-F2009 F1996 F1998 F2000 F2002 F2004 F2006 F2008 F2010 $ | & B20 mm ee co ee ee wt sme es 2 2 $30 -- 3 a Net Medicare (Part D) Liabilities 3 @ $40 — | aNet Medicare (Part A & B) Liabilities re) £ a Net Social Security Liabilities < $50 iienae ” 5 a Federal Employee & Veteran Benefits Payable $60 -- ™@FederalDebt; @0022 22 2 2 2 pos Medicare liabilities down sharply owing to slower 1 All Other healthcare cost growth assumptions associated $70 ~~ --- ~~ - ee eee fee withthe. 2010 Healthcare reform. --__-_ - - Note: USA Inc.’s balance sheet presented here does not include the financial value of the Government's sovereign powers to tax, regulate commerce, and set monetary policy. It also excludes ifs control over nonoperational resources, including national and natural resources, for which the Government is a steward. Total liabilities include the net present value (NPV) of unfunded entitlement liabilities like Social Security / Medicare / other payments, which the Treasury Dept. considers ‘off-balance sheet’ responsibilities. U.S. government fiscal year ends in September. Source: U.S. Department of the Treasury, Financial Report on the U.S KP .Government, 1996 — 2009. (@E) www.kpcb.com USA Inc. | Balance Sheet Drilldown 214 HOUSE_OVERSIGHT_020948
Page 126 - HOUSE_OVERSIGHT_020949
Important Caveats on F2010 Medicare Liability Improvement e Medicare Part A and Part B unfunded liability improved to -$16 trillion in F2010, up 47% from -$31 trillion in F2009, per the Board of Medicare Trustees. e The improvement was driven primarily by downward revisions of future cost growth assumptions following enactment of healthcare reform in 2010. e However, Medicare’s Chief Actuary Richard Foster noted that “while the Patient Protection and Affordable Care Act, as amended, makes important changes to the Medicare program and substantially improves its financial outlook, there is a strong likelihood that certain of these changes will not be viable in the long range...Without major changes in health care delivery systems, the prices paid by Medicare for health services [as scheduled by current law] are very likely to fall increasingly short of the costs of providing these services...Congress would have to intervene to prevent the withdrawal of providers from the Medicare market and the severe problems with beneficiary access to care that would result. Overriding the productivity adjustments, as Congress has done repeatedly in the case of physician payment rates, would lead to far higher costs for Medicare in the long range than those projected under current law...For these reasons, the financial projections shown [here] for Medicare do not represent a reasonable expectation for actual program operations in either the short range (as a result of the unsustainable reductions in physician payment rates) or the long range (because of the strong likelihood that the statutory reductions in price updates for most categories of Medicare provider services will not be viable).” Note: Emphasis added. Source: Statement of Actuarial Opinion, 2010 Annual Report of the Boards of Trustees of the Federal r Hospital insurance and Federal Supplementary Medical insurance Trust Funds. www.kpcb.com USA Inc. | Balance Sheet Drilldown 215 Balance Sheet: Even Excluding Unfunded Entitlement Benefits, USA Inc.’s Net Worth = -$13 Trillion in F2010, Owing to $9 Trillion of Debt Total Assets / Liabilities / Net Worth of USA Federal Government, Using Government GAAP Accounting, F1996-F2010 mam Liabilities (ex. Unfunded Entitlement Benefits) USA Inc. Total Assets / Liabilities / Networth ($T) BAR i ae ae He = a = d mam Total Assets =e Net Worth (ex. Unfunded Entitlement Benefits) $20 - - - nn nn nn nn a a a a a @ NS @ a Qo c= N ive] wt Lo @ NS co a i=] o o o o oO oO oO eo oO oO i=] oO oO oO = o o o o oO i] eo i] eo oO eo eo oO eo oO = = = N N N N N N N N Le Ln Le ie Le rm Le re Le Le Le Le Le Le Le Note: USA iInc.’s balance sheet presented here does not include the financial value of the Government's sovereign powers to tax, regulate commerce, and set monetary policy. It also excludes its control over nonoperational resources, including national and natural resources, for which the Government is a steward. Total liabilities exclude the net present value (NPV) of unfunded entitlement liabilities like Social Security / Medicare / other payments, which the Treasury Dept. considers ‘off-balance sheet’ KP responsibilities. U.S. government fiscal year ends in September. Source: U.S. Department of the Treasury, Financial Report on the U.S. Government, 1996 — 2010. (@E) www.kpcb.com USA Inc. | Balance Sheet Drilldown 216 HOUSE_OVERSIGHT_020949
Page 127 - HOUSE_OVERSIGHT_020950
Balance Sheet: Observations of Last Ten Years e Unfunded promise of future entitlement spending grew 6x to -$31 trillion, owing to rapidly rising healthcare cost + new Medicare Part D program + aging population in the medium-future. e Federal net debt outstanding more than doubled to $9 trillion on the back of chronic budget deficits, two major recessions in 2001 and 2008, and growing entitlement spending. e Federal employee & veteran benefits outstanding also more than doubled, to $5.7 trillion, thanks to rising healthcare costs and ongoing war on terror. KP i USA Inc. | Balance Sheet Drilldown 217 This page is intentionally left blank. 218 HOUSE_OVERSIGHT_020950
Sponsored
Page 128 - HOUSE_OVERSIGHT_020951
219 220 HOUSE_OVERSIGHT_020951
Page 129 - HOUSE_OVERSIGHT_020952
What Might a Turnaround Expert— Empowered to Improve USA Inc.’s Financials—Consider? Pau bs www.kpcb.com USA Inc. | What Might a Turnaround Expert Consider? 221 First, Examine USA Inc. Key Drivers of Revenue & Expenses... e USA Inc.'s Revenue = Highly Correlated (83%) with GDP Growth* — 90% of USA Inc.'s 2010 revenue derived from taxing individual and corporate income, which depends on GDP growth and changes to tax rates / composition. e USA Inc.'s Expenses = Less (73%) Correlated with GDP Growth* — Entitlement Programs = 57% of USA Inc.'s expenses in 2010 e driven by government policy + demographic changes ~ Defense Programs = 20% of expenses e driven by external threat levels and policy — Net Interest Payments = 6% of expenses e driven by net debt level + interest rates + composition of debt maturity Observation: while revenue is highly correlated with GDP growth, expenses are less so. Note: *Historical inflation-adjusted correlation between GDP and revenue / expense Y/Y growth rates from 1940 to 2010, GDP / revenue adjusted using GDP deflator; expenses adjusted using White House OMB’s composite outlay deflator. Nominal revenue / GDP correlation K P| over the same period is 84%; expense / GDP correlation is 71%. Data source: White House Office of Management & Budget, CBO. CB www.kpcb.com USA Inc. | What Might a Turnaround Expert Consider? 222 HOUSE_OVERSIGHT_020952
Page 130 - HOUSE_OVERSIGHT_020953
Then, Aim to Determine What ‘Normal’ Is... e We review 40-year income statement patterns and focus on ‘average’ / ‘normal’ levels of USA Inc.’s revenue drivers (primarily related to taxes) and expense drivers (by category) as a percent of revenue, as a starting point to help define ‘average’ / ‘normal.’ e Established businesses typically determine their expense levels based on their revenue trend / outlook. e In a perfect world, the government (and its citizens) would continually review the multiple variables in the income statement of USA Inc. (in a bipartisan way) and would work hard to foster compromise, in order to optimize revenue and expenses for the long term AND the short term. KP www.kpcb.com USA Inc. | What Might a Turnaround Expert Consider? 223 Considering USA Inc. ‘Normal’ / Average Financial Metrics / Ratios For... 1) Revenue Growth 2) Revenue Drivers as Percent of Revenue 3) Expense Growth by Category 4) Category Expenses as Percent of Expenses KP www.kpcb.com USA Inc. | What Might a Turnaround Expert Consider? 224 HOUSE_OVERSIGHT_020953
Sponsored
Page 131 - HOUSE_OVERSIGHT_020954
Revenue Growth: Average Federal Revenue (Driven by Taxes) In-Line With GDP Growth 1965 — 2005 USA Real Federal Income Growth by Category vs. Real GDP Growth Revenue Growth ‘05 vs 40-yr 1965 Y/Y 2005Y/Y | 40-yr CAGR| Variance Comments Individual Income Taxes 11% 11% 3% 8% Individual & corporate income taxes are cyclical; 2005 Y/Y growth were significantly Corporate Income Taxes 15 43 2 41 affected by economic recovery post 2001 recession. Social Insurance Taxes 12 5 1 Social insurance taxes & other fees are less cyclical. Social insurance taxes grew Other Taxes & Fees -5 1 1 0 significantly faster than GDP. Total Federal Revenue 9% 11% 8% Real GDP 7% 3% 0% “Normal” Note: All data are inflation adjusted using GDP price index from BEA; ’05 vs. 40-yr variance is rounded. KP Data source: White House Office of Management & Budget. (@)E) www.kpcb.com USA Inc. | What Might a Turnaround Expert Consider? 225 Revenue Growth: Observations from Previous Slide We chose a 40-year period from 1965 to 2005 to examine ‘normal’ levels of revenue and expenses. We did not choose the most recent 40-year period (1969 to 2009) as USA was in deep recession in 2008 / 2009 and underwent significant tax policy fluctuations in 1968 /1969 and subsequently many metrics (like individual income and corporate profit) varied significantly from ‘normal’ levels. Total USA Inc. revenue (collected via taxes) has grown at an average 3% annual rate, in-line with 40-year GDP growth rate. Corporate taxes have -— on average — grown at 2% annually over 40 years. Social insurance taxes (for Social Security and Medicare) have grown at an average 5% annual rate, above the 3% GDP growth. Questions: 1) How crucial is the role played by lower relative tax rates — especially for corporations — in stimulating job and GDP growth and helping American maintain / gain / constrain loss of global competitive advantage? 2) Should social insurance tax growth be more closely aligned with GDP growth? Note: All data are inflation adjusted using GDP price index from BEA; 05 vs. 40-yr variance is rounded. KP Data source: White House Office of Management & Budget. www.kpcb.com ne. at Might a Turnaround Expert Consider? B kpeb USA Inc. | What Might a T id rt Consider? 226 HOUSE_OVERSIGHT_020954
Page 132 - HOUSE_OVERSIGHT_020955
Revenue Drivers as Percent of Total Revenue: Average Federal Revenue Are Skewed to Social Insurance (Entitlement) Taxes and Away from Corporate Income Taxes 1965 — 2005 USA Real Federal Income Mix by Category Share of Total Revenue 40-yr ‘05 vs 40-yr 1965 2005 Average Variance Individual Income Taxes 42% 43% 46% -3% Corporate Income Taxes 22 13 12 1 Social Insurance Taxes 19 37 33 4 Other Taxes & Fees 17 7 10 -3 Total Federal Revenue 100% 100% 100% 0% “Normal” Note: All data are inflation adjusted using GDP price index from BEA; ’05 vs. 40-yr variance is rounded. KP Data source: White House Office of Management & Budget. (@)E) www.kpcb.com USA Inc. | What Might a Turnaround Expert Consider? 227 Revenue Drivers as Percent of Revenue: Observations from Previous Slide Social Insurance taxes (for entitlement programs) have risen materially to 37% of revenue (vs. 33% 40-year average), and have risen aggressively from 19% in 1965, owing to introduction of Medicare in 1965 and the 1983 reform of social security taxes. Questions: 1) What level of social insurance / entitlement ‘tax’ can USA Inc. support on an on-going basis? Rising from 19% of revenue in 1965 to 33% of revenue in 2005 — of which 75% was spent on healthcare — takes its toll on other areas of spending / growth. There are serious tradeoffs - every dollar that goes to entitlement programs is not spent on education, infrastructure, and defense. 2) Why have corporate income taxes fallen to 13% of revenue in 2009 from 22% in 1965 aside from recession? How crucial has this been to maintain global competitive advantage and stimulating American job and GDP growth? Note: All data are inflation adjusted using GDP price index from BEA; 05 vs. 40-yr variance is rounded. KP Data source: White House Office of Management & Budget. (@E) www.kpcb.com USA Inc. | What Might a Turnaround Expert Consider? 228 HOUSE_OVERSIGHT_020955
Page 133 - HOUSE_OVERSIGHT_020956
Expense Growth by Category: Entitlement Spending Growing Much Faster than Other Expenses and 2% Higher than GDP Growth 1965 — 2005 USA Real Federal Expenses Growth by Category vs. Real GDP Growth Expenses Growth ‘05 vs. 40-yr 4965YY 2005Y/Y |40-yrCAGR| Variance Comments Entitlement Expenses 12% 3% -3% Entitlement expenses grew 2 percentage points faster than GDP and overall expenses Defense 12 6 4 Defense spending grew 2 . . . percentage points below overall Non-Defense Discretionary 10 6 4 expenses Net Interest Payments ré 12 8 Total Federal Expenses 11% 5% 2% Real GDP 7% 3% 0% Note: All data are inflation adjusted using GDP price index from BEA; ’05 vs. 40-yr variance is rounded. *Non-defense discretionary KP spending includes education, infrastructure, agriculture, housing, etc. Data source: White House Office of Management & Budget. (@)E) www.kpcb.com USA Inc. | What Might a Turnaround Expert Consider? 229 Expense Growth by Category: Observations from Previous Slide While GDP and USA Inc. tax revenue have grown at a 3% annual rate for 40 years, entitlement spending has grown 5%, net interest payments have risen 3%, and defense plus non-defense discretionary spending (including education, infrastructure, law enforcement and judiciary) have risen by 1%. These different growth rates have become even more pronounced in recent years. Questions: 1) Isn’t it time for a re-set and acknowledgment of trade-offs? Should taxes, non-defense discretionary spending, and defense spending grow in line with GDP over time? Should entitlement spending be restructured to be more efficient and supportable by the ongoing financial dynamics of USA, Inc. and also grow in line with or below GDP? Note: All data are inflation adjusted using GDP price index from BEA; 05 vs. 40-yr variance is rounded. KP Data source: White House Office of Management & Budget. (@E) www.kpcb.com USA Inc. | What Might a Turnaround Expert Consider? 230 HOUSE_OVERSIGHT_020956
Sponsored
Page 134 - HOUSE_OVERSIGHT_020957
Expense Drivers as Percent of Total Expenses: Entitlement + One-Time Items Are Crowding Out Other Federal Spending 1965 — 2005 USA Real Federal Expenses Mix by Category Share of Total Expenses 40-yr ‘05 vs. 40-yr 1965 2005 Average Variance Entitlement Expenses 21% 51% 42% 9% Defense 43 20 24 -4 Non-Defense Discretionary* 29 22 23 -1 Net Interest Payments 7 7 11 4 Total Federal Expenses 100% 100% 100% 0% Normal Note: All data are inflation adjusted using GDP price index from BEA; ’05 vs. 40-yr variance is rounded. *Non-defense discretionary KP spending includes education, infrastructure, agriculture, housing, etc. Data source: White House Office of Management & Budget. (@)E) www.kpcb.com USA Inc. | What Might a Turnaround Expert Consider? 231 Category Expenses as Percent of Expenses: Observations from Previous Slide Entitlement spending has risen to 51% of total spending, higher than 40- year average of 42% (and much higher than the 21% in 1965), defense spending has fallen to 20% from 24% average, non-defense discretionary spending (including education, infrastructure, energy, law enforcement and veteran services) has fallen to 22% from 23%, and net interest payments have fallen to 7% from 11%, despite higher debt (largely because of declining interest rates). These trends have become more pronounced in recent years. Questions: 1) Should entitlement spending account for 51% (and rising) share of total USA Inc.’s spending, while other key areas (such as education, infrastructure, energy, law enforcement...) account for only 22% (and falling) of spending? Note: All data are inflation adjusted using GDP price index from BEA; ’05 vs. 40-yr variance is rounded. KP Data source: White House Office of Management & Budget. (@E) www.kpcb.com USA Inc. | What Might a Turnaround Expert Consider? 232 HOUSE_OVERSIGHT_020957
Page 135 - HOUSE_OVERSIGHT_020958
Bottom Line, as Data in This Presentation Indicate... USA Inc.’s expenses far exceed revenue — and government projections imply this trend will get worse, not better. In addition - while not addressed in depth in this presentation - USA Inc. (while still a global powerhouse), at the margin, is losing competitive advantage to many other countries. Instead of ignoring the problems, we simply ask the question... How would a financial / turnaround expert look at USA Inc.’s financials, business model, strategic plans, efficiency and aim to drive the ‘business’ to break-even (or a modest profit) over the next 5-10 years? KP www.kpcb.com USA Inc. | What Might a Turnaround Expert Consider? 233 Matching Expenses & Revenue: Imperatives & Constraints There are many reasons to make changes — USA Inc. is losing money, and forecasts imply it will continue to lose money. — Net debt levels (62% in F2010) are expected to surpass 90% threshold* — above which real GDP growth could slow by more than one percentage point — by 2021E. Spending (primarily related to entitlement programs) is at unsustainable levels based on USA Inc.'s ability to fund the spending (without increasing debt levels). — Americans rank ‘reducing America’s debt’ as one of country’s top priorities, according to a national survey by Peter G. Peterson Foundation in 11/09. — We are now in the midst of a major generational baton-passing (from the Baby Boomers to Generation X) which requires preparation for policy change. — Foreigners own 46% (and rising) of USA Inc.’s debt, per Treasury Department — Are they going to keep funding USA Inc.’s spending? Note: *Carmen Reinhart and Kenneth Rogoff observed from 3,700 historical annual data points from 44 countries that the relationship between government debt and real GDP growth is weak for debt/GDP ratios below a threshold of 90 percent of GDP. Above 90 percent, median growth rates fall by one percent, and average growth falls considerably more. We note that while Reinhart and Rogoff’s observations are based on ‘gross debt’ data, in the U.S., debt held by the public is closer to the European countries’ definition of government gross debt. For more information, see Reinhart and Rogoff, “Growth in a Time of Debt,” 1/10. www.kpcb.com USA Inc. | What Might a Turnaround Expert Consider? 234 HOUSE_OVERSIGHT_020958
Page 136 - HOUSE_OVERSIGHT_020959
Matching Expenses & Revenue: Imperatives & Constraints There are many constraints to making changes — ~90 million citizens (29% of Americans)’ have grown accustomed to entitlement programs - 47MM on Medicaid, 45MM on Medicare, and 51MM on Social Security, and many of them vote. — Politicians depend on re-election campaigns, which can create conflicts, especially given that only 12% of the population are willing to cut Social Security and Medicare benefits, per Pew survey in 2/11. — Low personal savings rates (near 6% of disposable income in CQ2:10), high unemployment (near 10%) and economic uncertainty, which can limit ability to make radical change. - 14 million healthcare-related workers? have grown accustomed to relatively high healthcare spending. Note: 1) as of 2008, exciudes double counting of beneficiaries of multiple entitlement programs; 2) as of 2008, per BEA. Source: K P Social Security Administration, Dept. of Health & Human Services, BEA. (@)E) www.kpcb.com USA Inc. | What Might a Turnaround Expert Consider? 235 And Then There’s the Constraint of USA Inc.’s Weak Economy [The] typical error most countries make coming out of a financial crisis is they shift too quickly to premature restraint. You saw that in the United States in the 30s, you saw that in Japan in the 90s. It is very important for us to avoid that mistake. If the government does nothing going forward, then the impact of policy in Washington will shift from supporting economic growth to hurting economic growth. Timothy Geithner, Secretary of US Treasury The Wall Street Journal, September 12, 2010 KP www.kpcb.com USA Inc. | What Might a Turnaround Expert Consider? 236 HOUSE_OVERSIGHT_020959
Sponsored
Page 137 - HOUSE_OVERSIGHT_020960
High-Level Thoughts on How to Turn Around USA Inc.’s Financial Outlook KP www.kpcb.com USA Inc. | What Might a Turnaround Expert Consider? 237 Negative Cash Flow = USA Inc.'s Fundamental Financial Problem e Negative cash flow implies that USA Inc. can't afford the services it is providing to ‘customers’ (citizens). e USA Inc. needs to re-prioritize its services and offer them in a more cost-effective way to stop losing (and borrowing) money. e The financial data imply that USA Inc.'s operations must be restructured. KP www.kpcb.com USA Inc. | What Might a Turnaround Expert Consider? 238 HOUSE_OVERSIGHT_020960
Page 138 - HOUSE_OVERSIGHT_020961
The First Step to a ‘Turnaround’ is Acknowledging There is a Problem A turnaround situation is first recognized when there is serious concern or dissatisfaction with the firm's [organization's] performance, results, and/or near-term forecasts of [financial] performance and results. - Richard Sloma, The Turnaround Manager's Handbook If your organization is in trouble, be honest. Make it absolutely clear to everyone in the company that survival [long-term viability] depends on cost management. - Jon Meliones, “Saving Money, Saving Lives,” Harvard Business Review on Turnarounds KP www.kpcb.com USA Inc. | What Might a Turnaround Expert Consider? 239 How Might a ‘Turnaround Expert’ Look at an Organization that Needs to be ‘Turned Around?’ The recovery of a [challenged] company [or country]...depends on the implementation of an appropriate rescue plan or turnaround prescription. Characteristics of the appropriate remedy are that it must: 1) address the fundamental problems; 2) tackle the underlying causes (rather than the symptoms) and 3) be broad and deep enough in scope to resolve all the key issues. - Stuart Slatter, David Lovett, Laura Barlow, Leading Corporate Turnaround KP www.kpcb.com USA Inc. | What Might a Turnaround Expert Consider? 240 HOUSE_OVERSIGHT_020961
Page 139 - HOUSE_OVERSIGHT_020962
Aim to Answer Questions Like These About USA Inc.... Strategy / Financial Model Which countries (or states) have ‘best practices’ (based on productivity and outcomes) in key areas of operations (like healthcare, retirement plans, welfare, defense, education, infrastructure) — which of these best practices can / should be implemented by USA Inc.? What is the organization trying to solve for - what is USA Inc.'s mission? / Who are USA Inc.'s customers? Is USA Inc. providing its customers an optimized mix of services, based, in part, on ability to fund the services? Are there ‘business lines’ that USA Inc. should exit / scale back / expand? Why is USA Inc. spending more money than it brings in (and borrowing more money) — what are the checks and balances? What do USA Inc.'s financials tell us about the health of the business? Should USA Inc. consider a capital budget separated from the operating budget to ensure sufficient levels of investment in education, technology and infrastructure? What are the best attributes / biggest problems of USA Inc.'s business? Does USA Inc. have a path to profitability (or break-even)? How should the government improve transparency in long-term budgeting and projections? How can USA Inc. engage the public in this process? USA Inc. | What Might a Turnaround Expert Consider? 241 Source: KPCB and Alvarez & Marsal Public Sector Services, LLC. (@)E) www.kpcb.com ...Aim to Answer Questions Like These About USA Inc.... People / Organizational Structure Has management effectively articulated a sound mission to its employees and constituents - is USA Inc. properly organized to effectively achieve its mission? Does the organization have the right people, in the right places, at the right time? Does the business have a best-in-class leadership team and are they empowered to make change? Are employees motivated / empowered / accountable for maximum performance? Are employees properly trained and compensated? Has the organization 'run the numbers’ and effectively quantified the things that are quantifiable? Do leading performance measures exist that support proactive management? How do you change the culture to be one that is steeped with focus on costs savings and operating efficiency? Source: KPCB and Alvarez & Marsal Public Sector Services, LLC. (@E) www.kpcb.com USA Inc. | What Might a Turnaround Expert Consider? 242 HOUSE_OVERSIGHT_020962
Sponsored
Page 140 - HOUSE_OVERSIGHT_020963
...Aim to Answer Questions Like These About USA Inc. Productivity / Operations How does USA Inc. measure performance and progress — are tools in place to measure success / failure? Should USA Inc. empower an independent / 3rd party auditor with expertise in government operations around the world AND corporate turnarounds to conduct a broad-ranging audit of USA Inc.’s operations to measure efficiency and productivity of each business lines? Does USA Inc. have tight management and financial controls? What is the best way to measure and improve individual program performance? Can Congress, the administration and the agencies agree on common metrics? Are there operations that should be centralized (like procurement, human resources, employee payroll and benefits) and decentralized? Are there operations that USA Inc. can outsource to local private companies to improve efficiency and reduce costs? Where should USA Inc. increase and or decrease investment? Is USA Inc. investing for the future in a responsible way? Should USA Inc. drive public / private partnership in infrastructure investment with collective ‘skin in the game?’ Is the organization leveraging technology to improve productivity and connect with customers and suppliers? How can USA Inc. improve business process related to time, cost and quality? Does USA Inc. own assets it doesn't need that it can sell at attractive prices? USA Inc. | What Might a Turnaround Expert Consider? 243 Source: KPCB and Alvarez & Marsal Public Sector Services, LLC. (@)E) www.kpcb.com Three Principles for a USA Inc. ‘Turnaround’ from Louis Gerstner Do not impose “across-the-board” cost reductions - This is a simple and tempting remedy for an organization in fiscal trouble. But it is almost always unproductive. A truly effective organization needs incremental investments in programs that drive innovation and higher productivity. Moreover, across-the-board cuts are almost guaranteed to reduce morale, promote short-sighted choices, and encourage accounting gimmicks that send people looking for loopholes instead of creative solutions. Focus on programs, not costs - The greatest productivity gains come from asking questions such as: What things are we doing now that we do not need as much in the future? Can we eliminate them? Reduce their size? Provide them in a totally restructured fashion? Allow no exceptions - To drive a truly effective restructuring program, everything must be on the table. There can be no sacred cows—no part of the organization that is exempt from scrutiny. Every unit of the organization may not face a cut, but every unit needs to be rethought. KP Source: Louis V. Gerstner Jr. “Don’t Just Cut Government, Reinvent It,” Opinion in The Wall Street Journal, 2/1/2011. (@E) www.kpcb.com USA Inc. | What Might a Turnaround Expert Consider? 244 HOUSE_OVERSIGHT_020963
Page 141 - HOUSE_OVERSIGHT_020964
Financial Experts Tend to ‘Assume What Can Go Wrong, Will Go Wrong, and Usually Manage Expenses in that Way e In projecting scenarios, financial experts would note that USA Inc.’s revenue and expenses are highly correlated to economic changes — for example, a 0.1 percentage point slowdown in real GDP annual growth rate could worsen USA Inc.’s F2011-F2020E budget deficit by $288B, or 5% owing to lower tax revenue and higher welfare spending. Key Revenue Spending Deficit Economic a i What if... ($B/% of Base- ($B/% ofBase- ($B/% of Base- Variables P Case) Case) Case) G, Real GDP oes EERIE Real GDP growth a + S YN Growth 4.4% F2012-14E ee ple ae Sete Rate percen age poin (-1%) (--%) (-5%) lower per year 2.4% F2015-20E ee 46%. ona-month T- interest rates ate 1 Interest bills remmaneeninetety +$94B +$1,214B -$1,120B percentage point Rates higher (+0.3%) (+3%) (-19%) 5.5% on 10-year T- Eel notes Inflation is 1 a + + = Inflation 1.7% percentage point pene aa B oiler higher (+7%) (+7%) (-12%) KP Source: CBO, “The Budget and Economic Outlook: Fiscal Years 2010 to 2020,” 1/10. (@)E) www.kpcb.com USA Inc. | What Might a Turnaround Expert Consider? 245 Past Performance Does Not Guarantee Future Results — Japan’s Economic Miracle From 1960 to 1990 Rapidly Deteriorated Into the ‘Lost Decades’ of 1990’s & 2000’s Japan Real GDP Annual Growth Rates, 1960 — 2010 Inflection Point — Bursting of Real Estate Bubble in 1991 Real GDP Annual Growth Rates (%) 2000 1960 1965 1970 1975 1980 1985 199 2005 0 I I Average Annual Real GDP Growth, Japan vs. USA, 1960’s — 2000’s I I 1960’s 1970’s 1980’s 1990’s 2000’s Japan 10% 5% 4% ; 1.5% 0.7% I USA 4% 3% 3% I 4% 2% KP Source: World Bank, IMF. (@E) www.kpcb.com USA Inc. | What Might a Turnaround Expert Consider? 246 HOUSE_OVERSIGHT_020964
Page 142 - HOUSE_OVERSIGHT_020965
Unfunded Entitlement (Medicare + Social Security) + Underfunded Entitlement Expenditures (Medicaid) = Among Largest Long-Term Liabilities on USA Inc.'s Balance Sheet USA Balance Sheet Liabilities Composition, F2010 Unfunded Medicaid* Medicare $35.3T Unfunded $22.8T All se Veteran Federal Social Other Benente Benefits Debt Security $7.9T $1.6T $2.1T $3.7T $9.1T 2 @@ lL Note: Medicaid funding is appropriated by Congress (from general tax revenue) on an as-needed basis every year, therefore, there is no need to maintain a contingency reserve, and, unlike Medicare, the “financial status” of the program is not in question from an actuarial perspective. Here we estimated the net present value of future Medicaid spending through 2085E, assuming a i 3% discount rate. Data source: Dept. of Treasury, Dept. of Health & Human Services Center for Medicare & Medicaid Services. www.kpcb.com USA Inc. | What Might a Turnaround Expert Consider? 247 USA Inc.’s Financial Disconnect The country faces a fundamental disconnect between the services the people expect the government to provide, particularly in the form of benefits for older Americans, and the tax revenues that people are willing to send to the government to finance those services. That fundamental disconnect will have to be addressed in some way if the budget is to be placed on a sustainable course. - Douglas Elmendorf, Director of U.S. Congressional Budget Office, 11/10/2009 KP www.kpcb.com USA Inc. | What Might a Turnaround Expert Consider? 248 HOUSE_OVERSIGHT_020965
Sponsored
Page 143 - HOUSE_OVERSIGHT_020966
An Observation from Ben Bernanke, Current Chairman of the Federal Reserve A famous economist once said anything that can’t go on forever will eventually stop, and this [government liabilities from entitlement programs] will stop, but it might stop in a very unpleasant way in terms of sharp cuts, a financial crisis, high interest rates that stop growth, continued borrowing from abroad. So, clearly we need to get control of this over the medium term, and specifically we’re going to have to look at entitlements because that’s a very big part of the obligations of the federal government going forward. -- Ben Bernanke, Chairman of the Federal Reserve Testimony before House Budget Committee, June 9, 2010 KP Note: Emphasis added. (@)E) www.kpcb.com USA Inc. | What Might a Turnaround Expert Consider? 249 Bad News: USA Inc.’s Entitlement Programs are Inflation Indexed, Thus Potential Inflation — Which Would Reduce General Consumer Purchasing Power — Would Not Reduce Entitlement Liabilities Social Security, Medicare, Medicaid Spending (All Indexed to Inflation) as % Total Federal Spending 1970-2020E 50% 20% As Percentage of Total Outlays (%) 10% 0% 1970 1978 1986 1994 2002 2010E 2018E Pp Data sources: The Budget and Economic Outlook, CBO 6/10. www.kpcb.com USA Inc. | What Might a Turnaround Expert Consider? 250 HOUSE_OVERSIGHT_020966
Page 144 - HOUSE_OVERSIGHT_020967
Good News: While ‘Unfunded’ Liabilities Have Helped Bankrupt Companies, USA Inc.'s Unfunded Liabilities are Not Legal Contracts e Medicare / Social Security — While beneficiaries have a legal entitlement to receive benefits as set forth under the Social Security Act, Congress has the legal authority to change the levels of benefits and/or the conditions under which they are paid. Congress’s authority to modify provisions of the Social Security program was affirmed in the 1960 Supreme Court decision in Flemming v. Nestor, wherein the Court held that an individual does not have an accrued “property right” in Social Security benefits. The Court has made clear in subsequent decisions that the payment of Social Security taxes conveys no contractual rights to Social Security benefits. Medicaid — Benefit levels & eligibility are determined jointly by Federal and State governments. Federal funding is met through an appropriation by Congress (and can be adjusted annually). Source: Congressional Research Service, Social Security Reform: Legal Analysis of Social Security Benefits Entitlement Issues. (@)E) www.kpcb.com USA Inc. | What Might a Turnaround Expert Consider? 251 What Might a Turnaround Expert Consider? Focus on Expenses Reform Entitlement Programs Focus on Operating Efficiency (@E) www.kpcb.com Focus on Revenues Drive Sustainable Economic Growth Change Tax Policies USA Inc. | What Might a Turnaround Expert Consider? 252 HOUSE_OVERSIGHT_020967
Page 145 - HOUSE_OVERSIGHT_020968
Focus on Expenses: Reform Entitlement Programs + Focus on Operating Efficiency Focus on Expenses Pau bs www.kpcb.com USA Inc. | What Might a Turnaround Expert Consider? 253 For Each of the Major Problems, We Highlight: 1) Mathematical Illustrations and 2) Policy Options e Mathematical Illustrations — Here we simply calculate how big a revenue increase and/or expense decrease each major entitlement program needs to reach financial break- even. — These calculations are merely mechanical illustrations and are not meant to portray realistic solutions. e Policy Options — We do not take a view on preferred policy options. — We present policy options from our healthcare experts + 3 party organizations (such as the Congressional Budget Office and National Commission on Fiscal Responsibility and Reform) in an easy-to-understand format to raise awareness and illustrate the financial impact of policy decisions. CB www.kpcb.com USA Inc. | What Might a Turnaround Expert Consider? 254 HOUSE_OVERSIGHT_020968
Sponsored
Page 146 - HOUSE_OVERSIGHT_020969
Focus on Expenses if Dp bs www.kpcb.com USA Inc. | What Might a Turnaround Expert Consider? 255 Restructure Social Security: Variables To Make the Program Financially Break-Even for the Long-Term Mathematical Illustrations* Slide 257-259 1) Retirement age — increase it to 73, from 67? or 2) Social Security benefits — decrease them by 12%? or 3) Social Security tax rate — increase it by 2 percentage points? Policy Options Slide 261-267 1) Combination of some / all mathematical illustrations above? and/or 2) Consider / implement CBO’s various policy options on Social Security’s tax rates / taxable payroll / initial benefit formulas / cost-of-living adjustment... (July 2010)**? and/or 3) Consider / implement National Commission on Fiscal Responsibility and Reform’s policy proposals (November 2010)***? Note: *For mathematical illustrations, we simply calculate how big a revenue increase AND / OR expense decrease each major entitlement program needs to reach financial break-even. These caiculations are merely mechanical illustrations and are not meant to portray realistic solutions. **See: CBO, “Social Security Options 2010.” KP] ***See: National Commission on Fiscal Responsibility and Reform, CoChairs’ Proposal, 11.10.10 Draft Document. CB www.kpcb.com USA Inc. | What Might a Turnaround Expert Consider? 256 HOUSE_OVERSIGHT_020969
Page 147 - HOUSE_OVERSIGHT_020970
Restructure Social Security: Mathematical Illustration #1 — Increase Retirement Age From 67 to 73 Increase Retirement Age Full Retirement Age (Years) Current Proposed Note: For mathematical illustrations, we simply calculate how big a revenue increase AND / OR expense decrease each major entitlement program needs to reach financial break-even. These caiculations are merely mechanical illustrations and are not meant to portray realistic solutions. Note: Increase full retirement age to 73 will reduce average life expectancy at retirement to the same level as when Social Security was introduced in the KP late 1930s. Source: Melissa M. Favreault and Richard W. Johnson, The Urban Institute, “Raising Social Security’s Retirement Age,” 7/10. www.kpcb.com USA Inc. | What Might a Turnaround Expert Consider? 257 Restructure Social Security: Mathematical Illustration #2 — Reduce Social Security Expenses (Benefits) By 12% Reduce Social Security Benefits by 12%, Immediately & Permanently . $14,000 ------------ $13,010 @. -12% 2 $12,000 a £ e & $10,000 2. 5 2 2 > $8,000 a 8 ie 8 & $6,000 2 Ey e $4,000 <q S g $2,000 co) > & $0 2009 2010&Beyond Note: For mathematical illustrations, we simply calculate how big a revenue increase AND / OR expense decrease each major entitlement program needs to reach financial break-even. These calculations are merely mechanical illustrations and are not meant to portray realistic solutions. Source: Social Security Administration forecast in “The 2010 Annual Report of the Board of Trustees of the Federal Old-Age and Survivors Insurance KP and Federal Disability Insurance Trust Funds,” 8/10. (@ www.kpcb.com USA Inc. | What Might a Turnaround Expert Consider? 258 HOUSE_OVERSIGHT_020970
Page 148 - HOUSE_OVERSIGHT_020971
Restructure Social Security: Mathematical Illustration #3 — Increase Social Security Tax Rate From 12.4% to 14.2% Increase Social Security Tax Rate by 1.92 Percentage Points, Immediately & Permanently 12.4% a +1.92 Percentage Points Payroll Tax Rate (%) 4, . _ 2009 . . 2010&Beyond . . Note: For mathematical illustrations, we simply caiculate how big a revenue increase AND / OR expense decrease each major entitlement program needs to reach financial break-even. These caiculations are merely mechanical illustrations and are not meant to portray realistic solutions. Note: 1.92% is the estimated actuarial deficit for Social Security Trust Fund over a 75-year period from 2010 to 2085. Source: Social Security Administration forecast in “The 2010 Annual Report of the Board of Trustees of the Federal Old-Age and Survivors Insurance and K Pp Federal Disability Insurance Trust Funds,” 8/10. (@E www.kpcb.com USA Inc. | What Might a Turnaround Expert Consider? 259 Good News: Mathematical Illustrations to Fix Social Security’s Financial Problems Do Not Seem Drastic In fact, when Social Security was nearing bankruptcy in 1983, a combination of moderate reforms led to 25 consecutive years of operating surpluses. Highlights of 1983 Social Security Reform 1) Raised full retirement age to 67 by 2027 (from 65)* 2) Reduced annual benefits by 5% (via a 6-month delay in cost-of-living adjustment in 1983 & subsequent changes in benefit formulas and tax schemes) . 3) Raised Social Security tax rates by 2.3% (via an advancement in scheduled tax increase). 4) Made Social Security benefits (up to 50%) taxable income. Note: *For people born in 1937 or earlier, full retirement age (with 100% Social Security benefit) remained at 65. For people born after 1960, full retirement age was raised to 67. For people born between 1937 and 1960, the full retirement age progressively increases from 65 to 67. Source: Social Security Administration archive. (@ www.kpcb.com USA Inc. | What Might a Turnaround Expert Consider? 260 HOUSE_OVERSIGHT_020971
Sponsored
Page 149 - HOUSE_OVERSIGHT_020972
Restructure Social Security: Policy Options #1 — Combining Raising Retirement Age + Reducing Benefits + Raising Tax Rates Consider: 1) Increase retirement age by 0-9% and/or 2) Reduce social security benefits by 0-12%? and/or 3) Increase social security tax rate from 12.4% to 14.2%? and/or 4) Combination of some / all of the above & more? KP www.kpcb.com USA Inc. | What Might a Turnaround Expert Consider? 261 Restructure Social Security: Policy Options From the Congressional Budget Office (CBO) to Reduce Social Security Future Deficits By 1) Changing Tax Codes" Future Deficit Policy Options Reduction? (%) 2% gradually over a 20-year period 100% Increase Payroll Tax 3% gradually over a 60-year period 83 Rate by ... 1% in 2012 50 No limit, without Increasing benefits 150% No limit 100 Raise the Taxable Earnings Limit’ to ... $250,000, without Increasing benefits 83 90% of earnings 33 $106,800, without Increasing benefits 50% Impose 4% Tax on Earnings Above ... $250,000, without Increasing benefits 17 Note: 1) Benefits are adjusted as taxation is changed, unless specified otherwise 2) As % of the estimated present value of Social Security trust fund cumulative deficit in future 75 years. 3) Currently at $106,800 KP Source: CBO, “Social Security Options 2010.” (@E) www.kpcb.com USA Inc. | What Might a Turnaround Expert Consider? 262 HOUSE_OVERSIGHT_020972
Page 150 - HOUSE_OVERSIGHT_020973
Restructure Social Security: CBO’s Policy Options to Reduce Social Security Future Deficits By 2) Changing Benefit Formula Future Deficit Policy Options Reduction (%) To Index Initial Benefits to Prices Rather Than Earnings 167 % By ~33% for top 2 tiers of earnings? 117 Reduce Primary Insurance Amount' By 15% for all tiers of earnings 83 Factors ... iii By 0.5% every year for all tiers of earnings 67 By ~33% for the top tier of earnings 17 Earnings in AIME2 + Bend Points in PIA‘ to price 100% Bend Points in PIA’ formula to price 83 Index ... Earnings in AIME2 formula to price 33 Initial benefits to changes in life expectancy 33 Lower Initial The top 70% of earners 83% Benefits‘ for .. The top 50% of earners 67 Note: 1) Primary Insurance Amount (PIA): the benefit a person would receive if he/she elects to begin receiving retirement benefits at his/her normal retirement age 2) Average Indexed Monthly Earnings (AIME): an average of monthly income received by a beneficiary during their work life 3) Currently there are 3 tiers of earnings in calculation of PIA — top tier = 15% of monthly earnings over $4,586; tier 2 = 32% of monthly earnings between $761 and KP $4,586; tier 3 = 90% of monthly earnings below $761 4) Benefits for newly qualified individuals. Source: CBO, “Social Security Options 2010.” (@)E) www.kpcb.com USA Inc. | What Might a Turnaround Expert Consider? 263 Restructure Social Security: CBO’s Policy Solutions to Reduce Social Security Future Deficits By 3) Raising Retirement Age / Lower Cost-of-Living Adjustment Future Deficit Policy Options Reduction (%) To 70 50% Fs[uSs Full ReUreivert Index to life expectancy 33 Age To 68 17 Red It by 0.5 P t Point 50° Adjust Cost-of-living eeuce mney — a Adjustment’ Base It on the Chained CPI for All Urban Consumers 33 Notes: 1) Cost-of-Living Adjustment (COLA): increases of Social Security’s general benefit based on cost of living, as currently measured by CPI for Urban Wage Earners and Clerical Workers (CPI-W). KP Source: CBO, “Social Security Options 2010.” (@E) www.kpcb.com USA Inc. | What Might a Turnaround Expert Consider? 264 HOUSE_OVERSIGHT_020973
Page 151 - HOUSE_OVERSIGHT_020974
Restructure Social Security: Policy Options From Report of the National Commission on Fiscal Responsibility and Reform Future Social Security Policy Options Deficit Reduction’ Gradually reduce future benefit payments to high earners while Le) increasing them for low earners by 2050 ae Gradually increase taxable maximum to 90% of covered earnings 35% by 2050 Apply refined inflation measure (chained-CPI) to cost-of-living 26% index ° Gradually increase retirement ages to 68 by 2050 / 69 by 2075 21% Other? -- Total Future Social Security Deficit Reduction 116%? Note: 1) As % of the estimated present value of Social Security trust fund cumulative deficit in future 75 years. 2) Other measures include boosting benefit to oldest old retirees and covering newly hired state and local workers after 2020. 3) total deficit reduction does not equal to the sum of individual reductions owing to policy interplay. Source: National Commission on Fiscal Responsibility and Reform, “The Moment of Truth: Report of the National Commission on KP Fiscal Responsibility and Reform,” 12/1/10. (@)E) www.kpcb.com USA Inc. | What Might a Turnaround Expert Consider? 265 Restructure Social Security: Declining USA Household Savings Rate Creates Challenge to Reducing Benefits as Americans are Under-Saving, Thus Limiting Financial Cushion Personal Savings Rate, 1965 — 2009 Personal Savings Rate (%) BYo Nn I 3% A%, 2000s Average fp EEE ESSE a y= ss ms mom ome = sc ce em ee ee mo SR ea = Sn om = es oe mo oat ce ea me ces mo mea ol, Bison mem 2 0% [ T T T T T T T T T T T T T T T T T T T T 1965 1969 1973 1977 1981 1985 1989 1993 1997 2001 2005 2009 Note: Personal savings rate is calculated as the amount of savings divided by disposable income (income after taxes). P Source: BEA. (@E) www.kpcb.com USA Inc. | What Might a Turnaround Expert Consider? 266 HOUSE_OVERSIGHT_020974
Sponsored
Page 152 - HOUSE_OVERSIGHT_020975
Restructure Social Security: Especially High Unemployment Levels Also Create Challenge to Reducing Benefits USA Unemployment Rate, 1928 — 2010 YTD 25% 20% x x & 15% H 2 1948-2010 Average = Unemployment Rate s 5.7% = 10% | < 2 5% FCA — Pe a i 0% 1928 1933 1938 1943 1948 1953 1958 1963 1968 1973 1978 1983 1988 1993 1998 2003 2008 if D Source: BLS, 2010 data as of 8/10. i USA Inc. | What Might a Turnaround Expert Consider? 267 Focus on Expenses CB www.kpcb.com USA Inc. | What Might a Turnaround Expert Consider? 268 HOUSE_OVERSIGHT_020975
Page 153 - HOUSE_OVERSIGHT_020976
Restructure Medicare & Medicaid: Observations About America’s Healthcare System 1) High Expenses — however measured, the costs are high: a) total dollars; b) share of GDP relative to other countries; c) cost relative to ability to pay (government, business, or individual), and 2) Inefficiencies — both the data and the insights of doctors, nurses, patients, and healthcare professionals identify opportunities for more efficient communication, data sharing and cost saving. KP www.kpcb.com USA Inc. | What Might a Turnaround Expert Consider? 269 Restructure Medicare & Medicaid: Mathematical Challenge Related to Government Healthcare Programs Facing USA Inc. per CBO Forecasts Medicare & Medicaid Have Been Crowding Out Spending for Other Federal Programs and are Projected to Exceed All Federal Revenue by 2080E Federal Revenue & Medicare / Medicaid Spending as % of GDP, 1965 — 2080E FE i Federal Revenue as % of GDP (forecast based on historical trend line) Federal Spending on Medicare & Medicaid as 5% % of GDP Federal Revenue & Medicare / Medicaid Spending as % of GDP 0% 1965 1975 1985 1995 2005 2015E 2025E 2035E 2045E 2055E 2065E 2075E P Source: CBO Long-Term Budget Outlook alternative fiscal scenario, 6/10. (@E) www.kpcb.com USA Inc. | What Might a Turnaround Expert Consider? 270 HOUSE_OVERSIGHT_020976
Page 154 - HOUSE_OVERSIGHT_020977
Restructure Medicare & Medicaid: Variables in Restructuring Medicare & Medicaid to Reduce Material Impact on USA Inc.’s Expenses Mathematical Illustrations* Slide 273-274 1) Medicare benefits — reduce them by 53% (or cap them)? or 2) Medicare tax rate — increase it by 4 percentage points? Policy Options Slide 275-328 1) Combination of mathematical illustrations — reduce benefits and/or increase taxes? and/or 2) Isolate and address the drivers of medical cost inflation? and 3) Improve efficiency / productivity of healthcare system? and 4) Reduce services for some Medicaid beneficiaries? and 5) Consider / implement CBO’s 26 policy options that could reduce annual budget deficit by up to 38%?** and/or 6) Consider / Implement National Commission on Fiscal Responsibility and Reform’s medium- and long-term policy options*** Note: *Each mathematical illustration would bring Medicare Part A into long-term (75-year) actuarial balance. There is no mathematical illustration for Medicaid or Medicare Part B & D as there’s no ‘dedicated’ funding. “See: CBO, “Budget Options, Volume 1: Health Care,” 12/2008. KP ***See: National Commission on Fiscal Responsibility and Reform, “Co-Chairs’ Proposal,” 11/10/10. www.kpcb.com USA Inc. | What Might a Turnaround Expert Consider? 271 Restructure Medicare & Medicaid: Mathematical Illustrations* Mathematical Illustrations* 1) Medicare benefits — reduce / cap them? or 2) Medicare tax rate — increase it? Note: *For mathematical illustrations, we simply calculate how big a revenue increase AND / OR expense decrease each major entitlement program needs to reach financial break-even. These calculations are merely mechanical illustrations and are not meant to portray realistic solutions. KP www.kpcb.com USA Inc. | What Might a Turnaround Expert Consider? 272 HOUSE_OVERSIGHT_020977
Sponsored
Page 155 - HOUSE_OVERSIGHT_020978
Restructure Medicare & Medicaid: Mathematical Illustration #1 — Reduce Medicare Benefits* By 53% Sizing the problem: It would take massive (53%) benefit cuts to address the shortfall of Medicare* $2,434 Average Annual Medicare* Payments per Beneficiary ($) 20108Bey Note: For mathematical illustrations, we simply calculate 7099, a revenue increase AND / OR expense decrease each major LORS ont program needs to reach financial break-even. These calculations are merely mechanical illustrations and are not meant to portray realistic solutions. Source: Dept. of Health & Human Services forecast in “2009 Annual Report of the Boards of Trustees of the Federal Hospital Insurance and Federal Supplementary Medical insurance Trust Funds,” 5/09. *Note that data presented here are limited to Medicare Part A (Hospital Insurance) Trust Fund. Medicare Part B (Medical insurance) and Part D (Prescription Drug Benefits) are primarily funded via insurance premiums and general tax revenue transfers. Note also that data presented | here are estimates prior to PPACA (2009 healthcare reform). (@E www.kpcb.com USA Inc. | What Might a Turnaround Expert Consider? 273 Restructure Medicare & Medicaid: Mathematical Illustration #2 — Increase Medicare Tax Rate From 2.9% to 6.8% Sizing the problem: It would take massive (3.9 percentage points) payroll tax hikes on individual and g ------- businesses to address the Medicare* funding shortfall —_ 7 6 Se o 35 cI a“ x 4 = ° & 3 @ a 2009 2010&Beyond Note: For mathematical illustrations, we simply calculate how big a revenue increase AND / OR expense decrease each major entitlement program needs to reach financial break-even. These calculations are merely mechanical illustrations and are not meant to portray realistic solutions. Source: Dept. of Health & Human Services forecast in “2009 Annual Report of the Boards of Trustees of the Federal Hospital Insurance and Federal Supplementary Medical Insurance Trust Funds,” 5/09. *Note that data presented here are limited to Medicare Part A (Hospital Insurance) Trust Fund. Medicare Part B (Medical i... and Part D (Prescription Drug Benefits) are primarily funded via insurance premiums and general tax revenue transfers. Note also that data presented here are estimates prior to PPACA (2009 healthcare reform). www.kpcb.com USA Inc. | What Might a Turnaround Expert Consider? 274 HOUSE_OVERSIGHT_020978
Page 156 - HOUSE_OVERSIGHT_020979
Restructure Medicare & Medicaid: Policy Options Policy Options 1) Combination of mathematical solutions — reduce benefits and / or increase taxes? and/or 2) Isolate and address the drivers of rising healthcare costs? and 3) Improve efficiency / productivity of healthcare system? and 4) Reduce services for some Medicaid beneficiaries? and 5) Consider / implement CBO’s 26 policy options that could reduce annual budget deficit by up to 38%? and/or 6) Consider / Implement National Commission on Fiscal Responsibility and Reform’s medium- and long-term policy options? KP www.kpcb.com USA Inc. | What Might a Turnaround Expert Consider? 275 Restructure Medicare & Medicaid: Policy Option #1 Combination of mathematical solutions — reduce benefits and/or increase taxes? KP www.kpcb.com USA Inc. | What Might a Turnaround Expert Consider? 276 HOUSE_OVERSIGHT_020979
Page 157 - HOUSE_OVERSIGHT_020980
Restructure Medicare & Medicaid: Combination of Reducing Benefits (Including Covered Lives) & / or Raising Taxes Consider: 1) Reduce Medicare benefits by 53%? and/or 2) Increase Medicare tax rate from 2.9% to 6.8%? and/or 3) Some combination of all / some the above However you look at it, this math is draconian. A 53% cut in Medicare benefits and / or more than doubling taxes are unrealistic. The situation for Medicaid is even worse, as Medicaid has no dedicated funding source. Neither Medicare nor Medicaid has yet fully faced up to the crisis and reform that Social Security experienced in the early 1980s. KP www.kpcb.com USA Inc. | What Might a Turnaround Expert Consider? 277 Restructure Medicare & Medicaid: Policy Option #2 lsolate and address the drivers of rising healthcare costs KP www.kpcb.com USA Inc. | What Might a Turnaround Expert Consider? 278 HOUSE_OVERSIGHT_020980
Sponsored
Page 158 - HOUSE_OVERSIGHT_020981
Restructure Medicare & Medicaid: Isolate and Address the Key Drivers of Rising Healthcare Costs USA Total Healthcare Spending Has Risen Faster than Peers’ (France, UK and Japan)* Total Healthcare Spending as % of GDP 1970 , vi n a il 5% 11% A ~ 5% 0 ZS 0 0 0 8% 5% 0 Note: *Ranked by total healthcare spending in 2007; 1970 comparable data not available for Germany because of reunification. Source: OECD, U.S. Department of Health & Human Services, Kaiser Family Foundation. www.kpcb.com ne. at Might a Turnaround Expert Consider? B kpeb USA Inc. | What Might a T dE Consider? 279 Restructure Medicare & Medicaid: Incentives Support Healthcare Cost Growth ¢ Consumers demand healthcare services with less regard for the full economic impact as they pay only a fraction of the true cost out of pocket. ¢ Healthcare service providers are generally rewarded for pushing more services through the system, largely with relatively less regard for cost effectiveness. Bottom line = Powerful forces encourage spending related to social / economic / legal issues throughout the healthcare system. KP Source: Doug Simpson, Morgan Stanley Healthcare Research. www.kpcb.com USA Inc. | What Might a Turnaround Expert Consider? 280 HOUSE_OVERSIGHT_020981
Page 159 - HOUSE_OVERSIGHT_020982
Restructure Medicare & Medicaid: Social + Economic + Legal Factors Drive Incentives to Spend 1) Social — Growing + aging population (with related disproportionate spending on end-of-life care) and unhealthy lifestyles. 2) Economic — Healthcare service providers have financial incentives to perform more services and drive revenue while consumers often have little incentive to manage incremental cost. 3) Legal - Rising overhead from defensive medicine (to avoid lawsuits) and from regulatory compliance costs. KP Source: Morgan Stanley Healthcare Research. www.kpcb.com USA Inc. | What Might a Turnaround Expert Consider? 281 Restructure Medicare & Medicaid: Social Forces that Push Up Healthcare Spending 1) Growing and Aging Population 2) Unhealthy Lifestyles 3) Possible Solutions KP www.kpcb.com USA Inc. | What Might a Turnaround Expert Consider? 282 HOUSE_OVERSIGHT_020982
Page 160 - HOUSE_OVERSIGHT_020983
1) Growing and Aging Population 2) Unhealthy Lifestyles 3) Possible Solutions KP www.kpcb.com USA Inc. | What Might a Turnaround Expert Consider? 283 Restructure Medicare & Medicaid: Social Factors— USA is Aging...13% of Americans Over 65 Years Old, Up from 5% in 1930 Older Population (65+) as Percent of Total Population, 1930 / 1970 / 2010E Total Population 310MM Total Population 203MM Total Population 123MM Age 65+ 5% 1930 1970 2010E # of Elderly # of Elderly # of Elderly 6MM 20MM 40MM KP Source: US Census Bureau. www.kpcb.com USA Inc. | What Might a Turnaround Expert Consider? 284 HOUSE_OVERSIGHT_020983
Sponsored
Page 161 - HOUSE_OVERSIGHT_020984
Restructure Medicare & Medicaid: Social Factors— Older People Spend 2x More per Year on Healthcare than Younger Americans Share of Population vs. Healthcare Spending by Age Group, 2004 $16,000 = $14,000 $12,000 $10,000 $8,000 $6,000 $4,000 Annual Per Capita Healthcare Spending ($) $2,000 Population & Healthcare Spending % Share of Total $0 0-18 19-64 = Share of Population = Share of Healthcare Spending @ Annual Healthcare Spending per Person KP Source: Dept. of Health & Human Services, US Census Bureau. www.kpcb.com USA Inc. | What Might a Turnaround Expert Consider? 285 Restructure Medicare & Medicaid: Social Factors— ~28% of Annual Medicare Spending Geared Toward End-of-Life Care (Last 12 Months) 2008 Medicare Total Benefit Expense $363B * People 65+ spent $14,797 per Medicare Spending on year on healthcare on average in Recipient’s Final Year of Life $101B 2004, 3x what working-age people (19-64) spend. * It’s notable that ~28% of average Medicare recipient spending occurs in the final year of life and 12% occurs in the final two months of life. Sources: CMS, Medpac, Report to the Congress: Medicare Payment Policy, 3/10 www.kpcb.com USA Inc. | What Might a Turnaround Expert Consider? 286 HOUSE_OVERSIGHT_020984
Page 162 - HOUSE_OVERSIGHT_020985
1) Growing and Aging Population 2) Unhealthy Lifestyles 3) Possible Solutions KP www.kpcb.com USA Inc. | What Might a Turnaround Expert Consider? 287 Restructure Medicare & Medicaid: Social Factors— 32% of Americans Considered Obese in 2008, Up from 15% in 1990... USA Adult Obesity Levels by State, 1990, 1999, 2008 Obesity-Related Diseases 2008 ee & A Pr rane | oe Data a <10% B 10%—-14% 15%-19% il 20% -24% 25%-29% 230% Note: An adult is considered obese if his / her Body Mass Index (BMI) is over 30. Source: Centers for Disease Control Behavioral Risk Factor Surveillance K P System, “America’s Health Rankings, A Call to Action for People and Their Communities, 2009 Edition”. (@E) www.kpcb.com USA Inc. | What Might a Turnaround Expert Consider? 288 Diabetes / Cancer / Respiratory / Heart / Joint Diseases ... Obesity-Related Medical Costs $147 billion in 2008, up 2x from 1998 to 7% of Healthcare Cost HOUSE_OVERSIGHT_020985
Page 163 - HOUSE_OVERSIGHT_020986
Restructure Medicare & Medicaid: Social Factors— Rising Obesity Pushes Up Healthcare Cost e An estimated 7% of $2.1 trillion healthcare costs (including those linked to diabetes, cancer, heart / respiratory / joint diseases) were related to obesity in 2008. By comparison, that’s more than all corporate income tax revenue that year. Note: Nearly half of all people in the U.S. with European ancestry carry a variant of the fat mass and obesity associated (FTO) gene, vs. 25% of U.S. Hispanics, 15% of African Americans and 15% of Asian Americans, per UCLA. Source: “Annual Medical Spending Attributable To Obesity: Payer- And Service-Specific Estimates." Eric A. Finkelstein, Justin G. Trogdon, Joel W. Cohen, and William Dietz. Health Affairs , July 27, 2009. KP www.kpcb.com USA Inc. | What Might a Turnaround Expert Consider? 289 1) Growing and Aging Population 2) Unhealthy Lifestyles 3) Possible Solutions KP www.kpcb.com USA Inc. | What Might a Turnaround Expert Consider? 290 HOUSE_OVERSIGHT_020986
Sponsored
Page 164 - HOUSE_OVERSIGHT_020987
Restructure Medicare & Medicaid: Social Factors—Possible Solutions Boost Healthcare Education & Incentives to Drive Better Choices e Emphasize on disease prevention and wellness. — Education and information — Highlight health risk associated with certain behaviors and lifestyles — Financial incentives for healthy habits — Create social programs to champion healthy lifestyles and consumption — Subsidize healthy foods for lower income population Discourage unhealthy behavior and consumption. — Penalize poor health choices (create new incentives based upon lessons learned from higher life insurance fees for smokers and car insurance fees for speeders) — Consider additional / new taxes on cigarettes, non-diet sodas, etc. KP Source: Morgan Stanley Healthcare Research. www.kpcb.com USA Inc. | What Might a Turnaround Expert Consider? 291 Restructure Medicare & Medicaid: Economic Forces that Push Up Healthcare Spending 1) Open access healthcare plans can increase access to care (via greater choices of care providers), but can also increase cost. 2) Consumers and providers are not always incentivized to constrain their healthcare costs. 3) Even when appropriate, poor information & lack of price transparency complicate comparison shopping for consumers. 4) Advances in medical technology drive demand and costs. KP www.kpcb.com USA Inc. | What Might a Turnaround Expert Consider? 292 HOUSE_OVERSIGHT_020987
Page 165 - HOUSE_OVERSIGHT_020988
Restructure Medicare & Medicaid: Economic Factors— Rise in Usage of “Open Access” Healthcare Plans Makes It Harder to Control Patient Choices...Subsequently, Cost of Care Increases Societal demand for less restrictive health insurance has driven a gradual switch to open access plans. These plans offer consumers greater choices of medical providers, but at higher costs. Share of Tightly Managed vs. Open Access Healthcare Plans in USA, 1988 - 2008 ATi mee mm me = te ma i =~ Se —— Open Access (PPO + POS) —Tightly Managed (Conventional + HMO) % of All Healthcare Plans Other (HDHP) 0% T T T T T T T T T T T T T T 1 1988 1996 2000 2002 2004 2006 2008 Note: PPO is Preferred Provider Organization, which allows enrollees to select any doctor / hospital in the insurance provider's network without going through a primary care physician. HMO is Health Maintenance Organization, which requires enrollees to coordinate ail healthcare via a primary care physician (a family doctor). POS is Point Of Service, which combines the features of an HMO and a PPO. HDHP is High-Deductible Health Plan, a form of catastrophic coverage with lower premiums and higher deductibles than a traditional plan. Source: Kaiser/HRET Survey of Employer-Sponsored Health Benefits, 1999-2009; KPMG Survey of KP Employer-Sponsored Health Benefits, 1993, 1996; The Health Insurance Association of America (HIAA), 1988 (@E www.kpcb.com USA Inc. | What Might a Turnaround Expert Consider? 293 Restructure Medicare & Medicaid: Economic Factors— Less Incentive for Consumers or Providers to Control Costs When Someone Else (Government / Taxpayers) Pays the Bills Out-of-Pocket Spending Accounted for Just 12% of Healthcare Spending in 2009, Down from 48% in 1960 Out-of-Pocket Payments Medicare + Medicaid Payments == =Qut-of-Pocket Medical Payments as % of Disposable Income ~--- 35% Medicare Introduced Payments as % of Total Healthcare Spending C/O 1960 1965 1970 1975 1980 1985 1990 1995 2000 2005 KP Source: Department of Health & Human Services, Centers for Medicare & Medicaid Services. (@ www.kpcb.com USA Inc. | What Might a Turnaround Expert Consider? 294 HOUSE_OVERSIGHT_020988
Page 166 - HOUSE_OVERSIGHT_020989
Restructure Medicare & Medicaid: Economic Factors — Employer and Government Funding System Separates Consumers from True Costs of Healthcare e When one doesn’t pay directly and gets an expensive good / service for free (or well below cost), one tends to consume more - it’s basic supply and demand economics. e Count up the subsidies: — Medicaid: 47 million (24MM children / 12MM low-income adults / 7MM disabled / 4MM elderly) Americans (15% of population) each received $6,872 in taxpayer funds, on average, for healthcare in 2008 through Medicaid. That $6,872 equals ~19% of annual per-capita income for Americans. — Medicare: 45 million elderly Americans (15% of population) averaged $7,991 per person for healthcare in 2008 ($4,875 for hospital care; $3,116 for medical insurance and prescription drugs). That equals ~23% of annual per capita income. — Private Market: 157mm Americans with private health coverage (subsidized by employers) in 2008 paid just 16% of the total premium cost themselves for single coverage and 27% for family coverage. In effect, that represented tax- free “earnings” of $3,951 for singles or $9,256 for families (not including the tax savings on their personal premium contributions). Source: Department of Health & Human Services, Centers for Medicare & Medicaid Services. (@)E) www.kpcb.com USA Inc. | What Might a Turnaround Expert Consider? 295 Restructure Medicare & Medicaid: Economic Factors— Healthcare Providers Are Rewarded for Driving Revenue ¢ While striving to provide the best care possible, healthcare providers tend to have financial / legal / societal incentives to provide more care, all else equal. ¢« Reimbursement for providers is generally volume-based (e.g., more procedures generate more revenue for care providers), though there are efforts to increasingly focus on quality. Unlike car buyers, for example, who often disregard a dealer’s maxed-out model and choose only the features that are important to them and what they can afford, healthcare buyers tend to buy all the “features” as: 1) buyers (patients in this case) are typically not medical experts, so they defer to doctors / care providers for decisions; and 2) buyers only bear a small portion of the costs as someone else (employer or government) is paying for the features. KP www.kpcb.com USA Inc. | What Might a Turnaround Expert Consider? 296 HOUSE_OVERSIGHT_020989
Sponsored
Page 167 - HOUSE_OVERSIGHT_020990
Restructure Medicare & Medicaid: Economic Factors— Rising Healthcare Costs Disproportionately Borne by Employers and Individuals Over the last few decades, private payors (employer-sponsored health insurance plans) have consistently paid more than government payors (Medicare / Medicaid) and have, in effect, subsidized government reimbursement. Healthcare Service Payment to Cost Ratio, 1990 - 2006 0, 140% — Private Payor — ~~ Medicare — Medicaid 120% 110% 100% 90% Payment to Cost Ratio 80% 70% 60% | T T T T T T T T T T T T T T T T 1 1990 1992 1994 1996 1998 2000 2002 2004 2006 KP Source: Avalere Health Analysis of American Hospital Association Annual Survey data, 2006, for community hospitals. www.kpcb.com USA Inc. | What Might a Turnaround Expert Consider? 297 Restructure Medicare & Medicaid: Differential Payment Rates Can Create a Negative Cycle Leading to Erosion of Private Healthcare Coverage and Higher Entitlement Spending 5. Employers/ easing Use of 2. Cost Shi a ernment the Private ursement nment Lowers ursement Rate to Providers Private Marke Government Mar. KP ource: Doug Simpson, Morgan Stanley Healthcare Research. (@E) www.kpcb.com USA Inc. | What Might a Turnaround Expert Consider? 298 HOUSE_OVERSIGHT_020990
Page 168 - HOUSE_OVERSIGHT_020991
Restructure Medicare & Medicaid: Economic Factors— Reimbursement Reform Is Easier Said than Done Owing to Political Sensitivity... Percentage Contribution to Medicare Medical Cost Growth Rate by Spending Type, 2019E Nursing Home & Home Health Hospital Care All Other Rx Drugs Physician & Clinical Services (@)E] www.kpeb.com Key Issues: - Consumers understandably do not like constraints on their care location. - Doctors, nurses and hospitals are fulfilling a difficult task at the core of the healthcare delivery system. - Care providers are very important to local communities. - Local hospitals are large employers. - Many hospitals are struggling financially. Source: Data per CMS’ National Health Expenditure database, Doug Simpson, Morgan Stanley Healthcare Research. USA Inc. | What Might a Turnaround Expert Consider? 299 Restructure Medicare & Medicaid: Economic Factors— Healthcare Service Providers are Already “Underpaid” by Government USA Community Hospital Profit Margins & Inpatient Discharges by Payor Class 32% Profit margins by payor class (%), 2007 Percent of total inpatient discharges, by payor class (%), February Profit margins from patients with employer sponsored insurance are sufficient to leave hospital industry with positive overall margin, despite being only 36% of inpatient discharges. Reimbursement cuts to Medicare and/or Medicaid would pose significant challenges, as hospitals already realize negative margins from those payor classes. Source: Avalere Health analysis of American Hospital Association Annual Survey data, 2007, for community hospitals. Morgan Stanley Healthcare Research. 2009 Employer _ ecnenee Insurance (@ 2] www.kpcb.com USA Inc. | What Might a Turnaround Expert Consider? 300 HOUSE_OVERSIGHT_020991
Page 169 - HOUSE_OVERSIGHT_020992
Restructure Medicare & Medicaid: Economic Factors— Poor Information & Lack of Price Transparency Make it Harder for Consumers to “Comparison Shop” Patients are at a healthcare information disadvantage in two respects’: ¢ Lack of transparency: >» Its harder for consumers to compare prices of healthcare services from different healthcare providers than in other consumer markets given the complexity of healthcare market. > With employer- / government-subsidized insurance, many patients are ‘locked in’ with their insurance plans that do not incentivize “shopping around.” * Knowledge gap: > Unlike other markets where consumers tend to use their own information and preferences, consumers depend more on the advice and guidance of physicians or other healthcare suppliers. > Unlike other “merchandise,” healthcare is literally of life-and-death importance to consumers, making risk aversion — and price insensitivity — higher. This price insensitivity is exacerbated because the consumer, in effect, gets it at a discounted price anyway. KP Source: 1) Accounting for the cost of US healthcare, McKinsey Global institute www.kpcb.com USA Inc. | What Might a Turnaround Expert Consider? 301 Restructure Medicare & Medicaid: Economic Factors— Consumers Increasingly Demand Expensive Treatment and Are Able to Pay for it With Government Subsidies Total High-End Surgeries up 50x from 1970-2004, Driven by Medical Advancements + Consumer Ability to Spend Assisted by Government Payments # of Patients (Aged 50+) Undergoing Typical Costs per Advanced Procedures in USA Procedure ($) 1970 2004 Coronary Procedures ice tla <20,000 1.1 million $12,000 Implantation Pacemaker / ICD‘ <10,000 350,000 $15-34,000 Bypass <10,000 220,000 $28,000 Dialysis Procedures <10,000 480,000 ee nal Joint Replacement Procedures Hip <20,000 390,000 $12,500 Knee on 440,000 $12,500 Note: 1) ICD is Implantable Cardioverter Defibrillator, which is similar to a pacemaker but for a heart rhythm that beats too fast. Cost of procedure approximated by Medicare reimbursement. (@E) www.kpcb.com USA Inc. | What Might a Turnaround Expert Consider? 302 HOUSE_OVERSIGHT_020992
Sponsored
Page 170 - HOUSE_OVERSIGHT_020993
Restructure Medicare & Medicaid: Economic Factors— Unconstrained Access to Medical Technology Increases Cost of Care... e Researchers generally agree that advances in medical technology have contributed to rising US Health Spending! e Medical technology affects the costs of care through several “mechanisms of action”? — New treatments for previously untreatable terminal conditions — Major advances in clinical ability to treat previously untreatable acute conditions — New procedures for discovering and treating secondary diseases — New indications for a treatment over time — Ongoing, incremental improvements in existing capabilities — Major advances or the cumulative effect of incremental gains extending clinical practice to conditions once regarded beyond its boundaries e Very expensive, high-end medical procedures (such as dialysis and heart bypass) — which can easily cost as much as the average annual income of an American — are increasingly 60-70% subsidized by taxpayer dollars. Source: 1) “How Changes in Medical Technology Affect Healthcare Costs,” Kaiser Family Foundation, March 2007; 2) Richard A. Retting, “Medical Innovation Duels Cost Containment,” Health Affairs (Summer 1994). www.kpcb.com ne. at Might a Turnaround Expert Consider? B kpeb USA Inc. | What Might a T dE Consider? 303 Opportunity for Two Mutually Reinforcing Cycles: Information + Incentives... e More widespread adoption of healthcare information technology, in particular clinical decision support software, should yield better information and provider decisions. — Healthcare is at the cusp of leveraging decision-support technology after historically lagging other industries. — Opportunity to develop best practices to improve patient care and outcomes and reduce medical errors and costs. — More evidence-based care could help to narrow the variation in practice norms — The American Recovery and Reinvestment Act of 2009 provided approximately $19 billion for Medicare and Medicaid Health IT incentives. e Medpac summarizes the opportunities and issues succinctly. — "Drivers of investment in IT include the promise of quality and efficiency gains. Barriers include the cost and complexity of IT implementation, which often necessitates significant work process and cultural changes. Certain characteristics of the health care market—including payment policies that reward volume rather than quality, and a fragmented delivery system—can also pose barriers to IT adoption." Source: Morgan Stanley Healthcare Research. KP www.kpcb.com USA Inc. | What Might a Turnaround Expert Consider? 304 HOUSE_OVERSIGHT_020993
Page 171 - HOUSE_OVERSIGHT_020994
... Opportunity for Two Mutually Reinforcing Cycles: Information + Incentives Improving incentives for providers and consumers is also critical. — Providers need appropriate incentives to improve quality of care and lower costs. — Drivers include more widespread adoption of bundled payments and accountable care organizations. — Tort reform could play an important role. — Consumers need to take more responsibility for their own health and to utilize the healthcare system appropriately. — Appropriate social and financial incentives are key. Source: Morgan Stanley Healthcare Research. KP www.kpcb.com USA Inc. | What Might a Turnaround Expert Consider? 305 Restructure Medicare & Medicaid: Economic Factors—Possible Solutions 1) Cost-Sharing and/or 2) Reimbursement Reform and/or 3) Improving Cost & Quality Transparency and/or 4) Deploy Cost-Benefit Analysis for Medical Technology Spending KP www.kpcb.com USA Inc. | What Might a Turnaround Expert Consider? 306 HOUSE_OVERSIGHT_020994
Page 172 - HOUSE_OVERSIGHT_020995
Restructure Medicare & Medicaid: Economic Factors—Possible Solutions 1) Cost-Sharing * Cost-sharing can help control demand for a portion of healthcare by creating incentives for consumers to shop for most cost-effective treatments (although those benefits would be somewhat mitigated by the skew in health spending toward high users). * Once again, a Math Problem: Consider a routine physician office visit in which a provider suggests and / or patient requests various tests, procedures, etc. Patient #1 covered by a plan with a $20 co-pay (i.e., a flat fee regardless of the level or intensity of care performed during the visit) Patient #2 covered by a plan with a 10% co-insurance for in-network care (i.e., responsible for 10% of the aggregate billed charges) Clearly, patient #2 will become more sensitive to necessity and cost of care beyond a level of $200 of total healthcare services Note that deductibles drive similar dynamic as a co-pay: once the deductible is met, the member has little or no “skin in the game” * Only 14-18% of employer-sponsored health insurance plans use pro-rata cost sharing (i.e. co-insurance in example #2 above). Most (77%) insurance plans only use a co-pay (in example #1), which gives consumers little incentive to shop the most cost-effective treatment path. KP Source: Kaiser/HRET Survey of Employer-Sponsored Health Benefits, 2009 www.kpcb.com USA Inc. | What Might a Turnaround Expert Consider? 307 Restructure Medicare & Medicaid: Economic Factors—Possible Solutions 2) Reimbursement Reform Reimbursement reform could help shift drivers of payment from quantity of care to quality of care. The following list provides a few options to consider. * Bundled Payments: Providers get a fixed budget to treat an episode of care (i.e. a broken hip). Exceeding the budget means providers absorb additional costs; staying under it lets provider benefit from savings. Examples: PROMETHEUS Payment System’, Medicare Acute Care Episode Demonstration? * Global payment system@ (i.e., capitation): Providers are paid up-front to provide care that their patient receives over a period, incentivizing them to manage costs and quality. This global payment is adjusted periodically to reward accessible and high-quality care. * Pay for performance*: Reimbursement for care providers varies, based on various quality and efficiency measures such as discharge rate and readmission rate. * Accountable Care Organizations (ACOs): Provider groups accept responsibility for the cost and quality of care for a specific population of patients@ The recently enacted Patient Protection and Affordable Care Act includes regulations supporting the creation of Accountable Care Organizations Other models often discussed to improve coordination / efficiency and reduce costs : 1) integrated delivery systems; 2) multispecialty group practices; 3) physician-hospital organizations; 4) independent practice associations; 5) virtual physician organizations Source: 1) Cutting Healthcare Costs by Putting Doctors on a Budget, Time 1) Adopted in Rockford, iL in Jan 2010 2) Medicare Demonstration Project Overviews, www.cms.gov/demoprojects 3) Recommendations of the Special Commission on the Healthcare Payment, Commonwealth of Massachusetts 4) Pay for Performance incentive Programs in Healthcare , Geoffrey Baker 5) How the Center for Medicare & Medicaid Innovation Should Test Accountable Care KP Organizations, Stephen Shortell, Lawrence P. Casalino and Elliott S. Fisher for Health Affairs, July 2010 (@E) www.kpcb.com USA Inc. | What Might a Turnaround Expert Consider? 308 HOUSE_OVERSIGHT_020995
Sponsored
Page 173 - HOUSE_OVERSIGHT_020996
Restructure Medicare & Medicaid: Economic Factors—Possible Solutions 3) Improving Cost & Quality Transparency ¢ Improving cost and quality transparency of healthcare services could help doctors and patients make more informed decisions for each situation. ° Though enhancing competition and price transparency in healthcare is not easy,' new models for encouraging “comparison shopping” are emerging: - Castlight Health, a start-up financed by venture capitalists and the Cleveland Clinic, is working to build a search engine for healthcare prices? - Other services beginning to publish price information: Thomson Reuters, Change: healthcare, and health insurers (e.g., the Aetna Navigator)? * A 2007 study by Deloitte proposes a “Price Transparency Checklist for States”: provide prices for services that matter to consumers make it easy to understand keep care providers, insurance & pharmaceutical companies engaged and informed provide price and quality measures keep expanding price transparency initiatives maintain methodological rigor promote access and use of price information evaluate impact and ROI Source: 1) The Market for Medical Care: Why You Don’t Know the Price; Why You Don’t Know about Quality; And What Can Be Done About It, by Devon M. Herrick and John C. Goodman, March 12, 2007; 2) “Bringing Comparison Shopping to the Doctor's Office,” The New York Times, June 10, 2010; 3) Healthcare KP Price Transparency: A Strategic Perspective for State Government Leaders, by Deloitte Center for Health Solutions, 2007 www.kpcb.com USA Inc. | What Might a Turnaround Expert Consider? 309 Restructure Medicare & Medicaid: Economic Factors—Possible Solutions 4) Deploy Cost-Benefit Analysis for Medical Technology Spending e Deploying cost-benefit analysis for medical technology spending can help ensure we are spending resources wisely. e Directly measuring the impact of new technology on total healthcare spending — and its true value — is very difficult' e The Kaiser Foundation outlines some of the more common policy suggestions for dealing with this driver of costs: — Cost-effectiveness analysis (i.e., comparative effectiveness) — Rationing (unlikely to be adopted owing to political sensitivity), regulation, budget-driven constraints (used by other countries but generally not popular in the U.S.) — Market-based rationing (consumer-driven healthcare, pay-for- performance, information technology) Source: 1) “How Changes in Medical Technology Affect Healthcare Costs,” Kaiser Family Foundation, March 2007. (@E) www.kpcb.com USA Inc. | What Might a Turnaround Expert Consider? 310 HOUSE_OVERSIGHT_020996
Page 174 - HOUSE_OVERSIGHT_020997
Restructure Medicare & Medicaid: Legal Forces that Push Up Healthcare Spending 1) Defensive Medicine 2) Possible Solutions KP i USA Inc. | What Might a Turnaround Expert Consider? 311 Restructure Medicare & Medicaid: Legal Factors— “Defensive Medicine” Drives up Healthcare Spending ¢« Defensive Medicine consists of procedures or tests that a doctor orders to avoid possible future malpractice lawsuits. ¢ The practice is prevalent among US physicians and is contributing factor to healthcare spending. According to a survey of 824 physicians in 2005': - 93% said they had engaged in the practice of Defensive Medicine - 59% said they often ordered more diagnostic tests than medically necessary - 52% said they referred patients to other specialists in unnecessary circumstances - 33% said they often prescribed more medications than medically necessary Source: 1) David Studdert, et al., American Medical Association, “Defensive Medicine Among High-Risk Specialist Physicians K P in a Volatile Malpractice Environment,” 6/2005. a USA Inc. | What Might a Turnaround Expert Consider? 312 HOUSE_OVERSIGHT_020997
Page 175 - HOUSE_OVERSIGHT_020998
Restructure Medicare & Medicaid: Legal Factors—Possible Solution Tort Reform Could Reduce Incentives of Defensive Medicine Ways to control costs from tort litigation without jeopardizing patient health The CBO listed a package of tort reform proposals (10/09): Cap of $250,000 on awards for noneconomic damages for malpractice Cap on awards for punitive damages of $500,000 or twice the award for economic damages, whichever is greater Modification of the “collateral source” rule to allow evidence of income from such sources as health and life insurance, workers’ compensation, and automobile insurance and subtract it from jury awards A statute of limitations — one year for adults and three years for children — from the date of discovery of an injury Replacement of joint-and-several liability with fair-share rule: Defendants would be liable only for the percentage of a final award equal to their share of responsibility Source: Congressional Budget Office, Letter to the Honorable Orrin G. Hatch dated October 9, 2009; Congressional Budget K P Office, Letter to the Honorable John D. Rockefeller iV dated December 10, 2009 (@)E) www.kpcb.com USA Inc. | What Might a Turnaround Expert Consider? 313 Restructure Medicare & Medicaid: Legal Factors—Possible Solution Tort Reform Could Save USA Inc. $54 Billion Over Next 10 Years ¢ CBO estimates that a package of typical tort reform proposals could reduce total US health spending by 0.5% annually: — Direct savings: Roughly 0.2% of this reduction stems from lower national premiums for medical malpractice insurance. — Indirect savings: Another 0.3% stems from slightly lower utilization of services related to defensive medicine. ¢ Over 10 years, CBO estimated tort reform could reduce net healthcare spending by $54 billion: - Spending for Medicare, Medicaid, Children’s Health Insurance Program, and Federal Employees Health Benefits could fall ~$41 billion over the next decade (with the greatest savings in Medicare). - Federal tax revenues could rise by ~$13 billion as lower health insurance costs for employers could lead to higher take-home pay for employees and therefore higher income taxes for USA Inc. Source: Congressional Budget Office, Letter to the Honorable Orrin G. Hatch dated October 9, 2009; Congressional Budget Pp Office, Letter to the Honorable John D. Rockefeller iV dated December 10, 2009 (@E) www.kpcb.com USA Inc. | What Might a Turnaround Expert Consider? 314 HOUSE_OVERSIGHT_020998
Sponsored
Page 176 - HOUSE_OVERSIGHT_020999
Restructure Medicare & Medicaid: Policy Option #3 Improve Efficiency / Productivity of Healthcare System KP i USA Inc. | What Might a Turnaround Expert Consider? 315 Restructure Medicare & Medicaid: Most Businesses are Performance- Based, Many Components of Healthcare System are Not USA Healthcare Outcome (based on Life Expectancy) Have Room For Improvement Relative to Other Countries Healthcare Spending per capita vs. Average Life Expectancy Among OECD Countries, 2007 BEB ge Japan ~~ £ e° Fd - ” = se @ O80 ae er) Be a S. Korea@ es (2) e 5 - ! F re) — £ a @ UK ~_ — Linear Trend line (ex. USA) t x - wi ‘ USA 2 15 mse = i im et io ee oo Gs GH GI Re Gm RR tm oe KS Rm eo = Mexico @ S @ Hungary $ xt 70 i T T T T T T T 0 1000 2000 3000 4000 5000 6000 7000 o Total Expenditure on Health per capita, $US (PPP Adj.) Source: OECD a USA Inc. | What Might a Turnaround Expert Consider? 316 HOUSE_OVERSIGHT_020999
Page 177 - HOUSE_OVERSIGHT_021000
Restructure Medicare & Medicaid: In Addition to Life Expectancy, USA Falls Behind OECD Averages in Many Other Health Indicators OECD USA Ranking 2007 Health Indicators USA Median (1 = Best, 30 = Worst) RED = Below Average Obesity (% of total population) 34 15 30 Infant Mortality (per 1,000 live births) 7 4 27 Medical Resources Available (per 1,000 population) Total Hospital Beds 3 6 25 Practicing Physicians 2 3 22 Doctors’ Consultations per Year 4, 6 19 MRI Machines* (per million population) 26 9 1 Cause of Death (per 100,000 population) Heart Attack 216 178 22 Respiratory Diseases 60 45 21 Diabetes 20 12 20 Cancer 158 159 14 Stroke 33 45 8 KP Note: *MRI is Magnetic Resonance Imaging. Source: OECD. i USA Inc. | What Might a Turnaround Expert Consider? 317 Restructure Medicare & Medicaid: Effectiveness Research Could Improve Efficiency (i.e., Outputs Track Inputs) e Comparative Effectiveness evaluates different options for treating a condition for a specific set of patients’ — Either relative benefits and risks of various treatment options (technology assessment, evidence-based medicine), or — Both clinical effectiveness and relative cost (cost-benefit analysis). e Without rigorous data about comparative effectiveness, according to the CBO: — Treatment decisions often depend on anecdotal evidence, conjecture, and the experience/judgment of involved physicians. — Treatments and types of care vary widely from one area of the country to another. e To affect healthcare spending meaningfully, comparative effectiveness must alter doctor and patient behavior, potentially through reimbursement scheme changes, the CBO notes. e Note that by law, Medicare is effectively precluded from considering costs when making coverage decisions. K P Source: “Research on the Comparative Effectiveness of Medical Treatments”, A CBO Paper, December 2007. www.kpcb.com ne. at Might a Turnaround Expert Consider? B kpeb USA Inc. | What Might a T dE Consider? 318 HOUSE_OVERSIGHT_021000
Page 178 - HOUSE_OVERSIGHT_021001
Restructure Medicare & Medicaid: Policy Option #4 Reducing Optional Services + Optional Beneficiary Groups' Could Save Up to ~60% of Annual Medicaid Cost, per Kaiser Family Foundation Note: 1) Medicaid is a jointly financed federal and state program that provides health and long-term care services to 55 million low-income Americans. As a condition of participating in Medicaid, states are required to cover certain “mandatory” populations and to provide a specified set of benefits. States also have discretion to cover additional low-income individuals in each of these categories (“optional groups’) and receive federal matching payments. Optional eligibility categories include children and parents, persons with disabilities and the elderly above mandatory coverage limits; persons residing in nursing facilities; and the KP medically needy. Source: Kaiser Family Foundation, 2005 (@)E) www.kpcb.com USA Inc. | What Might a Turnaround Expert Consider? 319 Restructure Medicare & Medicaid: Policy Option # 4 — Reducing Optional Services + Beneficiary Groups! Could Save Up to 60% of Annual Medicaid Spending Medicaid Expenditures by Eligibility Group and Type of Service, 2001 Mandatory Mandatory Services’ for Services for Optional Mandatory Groups Groups Eliminating ; optional groups Federal-required mandatory services could save bat ~42% of total groups = ~40% Medicaid Optional =~ total spending di Services* for eet reultel Optional Groups Optional Services for Mandatory Groups Eliminating optional services could save ~30% of total Medicaid spending Note: 1) Medicaid is a jointly financed federal and state program that provides health and long-term care services to 55 million low-income Americans. As a condition of participating in Medicaid, states are required to cover certain “mandatory” populations and to provide a specified set of benefits. States also have discretion to cover additional low-income individuals in each of these categories (“optional groups”) and receive federal matching payments. Optional eligibility categories include children and parents, persons with disabilities and the elderly above mandatory coverage limits; persons residing in nursing facilities; and the KP medically needy. Source: Kaiser Family Foundation, 2005 (@E) www.kpcb.com USA Inc. | What Might a Turnaround Expert Consider? 320 HOUSE_OVERSIGHT_021001
Sponsored
Page 179 - HOUSE_OVERSIGHT_021002
Restructure Medicare & Medicaid: Examples of Medicaid’s Mandatory Beneficiaries & Services Examples of Mandatory Beneficiaries e Children under age 6 with family annual income below $20,841 Children age 6 or older with family annual income below $15,670 Pregnant women with annual income below $12,382 Elderly and disabled with annual income between below $6,768 (for an individual) (@)E) www.kpcb.com Examples of Mandatory Services Physician services Laboratory & x-ray services Inpatient hospital services Outpatient hospital services Rural health clinic services Certified pediatric and family nurse practitioner services Early & periodic screening, diagnostic, and treatment (EPSDT) services for individuals under 21 Note: Supplementary Security Income and Federal Poverty Levels are 2005 levels. Source: Kaiser Family Foundation, 2005. USA Inc. | What Might a Turnaround Expert Consider? 321 Restructure Medicare & Medicaid: Examples of Medicaid’s Optional Beneficiaries & Services Examples of Optional Beneficiaries e Disabled and elderly with annual income between $7,082 (Supplementary Security Income, or SSI) and $9,310 (Federal Poverty Level, or FPL) e Nursing home residents with annual income between $7,082 (SSI) and $21,000 (3x SSI) e Pregnant women with annual income above $12,382 (>133% of FPL) e Children under 6 with annual family income above $20,841 (@E) www.kpcb.com Examples of Optional Services Prescription drugs Dental services Rehabilitation and other therapies Prosthetic devices, eyeglasses, durable medical equipment Hospice services Inpatient psychiatric hospital services for individuals under age 21 e Other specialist medical or remedial care Note: Supplementary Security Income and Federal Poverty Levels are 2005 levels. Source: Kaiser Family Foundation, 2005. USA Inc. | What Might a Turnaround Expert Consider? 322 HOUSE_OVERSIGHT_021002
Page 180 - HOUSE_OVERSIGHT_021003
Restructure Medicare & Medicaid: Policy Option #5 Consider / Implement CBO’s 26 policy options that could reduce annual budget deficit by up to 38% over the next 10 years KP www.kpcb.com USA Inc. | What Might a Turnaround Expert Consider? 323 Restructure Medicare & Medicaid: CBO Policy Options— Regulate Private Health Insurance Market; Modify Tax Code; Modify Insurance Eligibility; Improve Efficiency Policy Options Gov. Future Deficit yp Reduction (%)' Require large employers to either pay government for providing insurance or offer employees basic insurance coverage Replace the income tax and payroll tax exclusion with a refundable credit Replace the income tax exclusion for employment-based health insurance with a deduction Reduce the tax exclusion for employment-based health insurance and the health insurance deduction for self-employed individuals Raise the age of eligibility for Medicare to 67 Convert Medicare and Medicaid “Disproportionate Share Hospital Payments” into a block grant Consolidate Medicare and Federal Medicaid payments for graduate medical education costs at teaching hospitals; set consolidated payment equal to: * Adjusted IME? payments using a 2.2% adjustment factor + DGME* and Medicaid GME? funding inflated by the CPI-U5 minus 1 percentage point * 90% total mandatory GME? funding inflated by the CPI-U minus 1 percentage point Note: 1) As % of Cumulative Total Government Deficit from 2010 to 2019 2) Graduate Medical Education 3) Indirect Medical P Education 4) Direct Graduate Medical Education 5) Consumer price index for all urban consumers Source: CBO www.kpcb.com USA Inc. | What Might a Turnaround Expert Consider? 324 HOUSE_OVERSIGHT_021003
Page 181 - HOUSE_OVERSIGHT_021004
Restructure Medicare & Medicaid: CBO’s Policy Options — Reduce Medicare / Medicaid Payments; Modify Premium and Cost-Sharing in Federal Health Programs Polley Options Gov. Future Deficit ii Reduction (%)' Reduce Medicare's payment rates across the board in high-spending areas 0.7% Remove or reduce the floor on Federal matching rates for Medicaid services * Remove the floor on the federal medical assistance percentage 3.3% * Reduce the floor on the federal medical assistance percentage to 45% 1.9% Reduce the taxes that states are allowed to levy on Medicaid providers 0.7% Increase the basic premium for Medicare Part B to 35% of the program's costs 3.2% Combine changes to Medicare's cost sharing with restrictions on Medigap policies? 1.1% Require a copayment for home health episodes covered by Medicare 0.7% Restrict Medigap coverage of Medicare's cost sharing 0.6% Introduce minimum out-of-pocket requirements under TRICARE for life 0.6% Note: 1) As % of Total Cumulative Government Deficit from 2010 to 2019 2) individual insurance policies designed to cover most or all of Medicare’s cost-sharing requirements. Source: CBO www.kpcb.com USA Inc. | What Might a Turnaround Expert Consider? 325 Restructure Medicare & Medicaid: Policy Option #6 Consider / Implement National Commission on Fiscal Responsibility and Reform’s medium- and long-term policy options KP www.kpcb.com USA Inc. | What Might a Turnaround Expert Consider? 326 HOUSE_OVERSIGHT_021004
Sponsored
Page 182 - HOUSE_OVERSIGHT_021005
Restructure Medicare & Medicaid: Medium-Term Policy Options From the Report of the National Commission on Fiscal Responsibility and Reform Deficit Reduction Medium-Term Policy Options F2012-F2020E’ Convert the federal share of Medicaid payments for long-term care into a capped allotment peerage Reform Tricare for Life? to increase cost sharing for Military retirees $55 Cut federal spending on graduate and indirect medical education $54 Reduce taxes that States may levy on Medicaid providers $49 Expand ACOs, payment bundling, and other payment reform $38 Accelerate phase-in of DSH payment cuts*, Medicare Advantage cuts $37 and home health cuts in PPACA Other* $73 Total Deficit Reduction F2012-F2020E $395 billion ore: OS! reducuons are Fiscal COMMISSION Staff estimates based on and oiner avaliable sources. Most numbers were generated pre-nealincare reform and may differ significantly. 2) Tricare for Life is a supplementary military health insurance designed to minimize Medicare-eligible military retirees’ out-of-pocket medical expenses. 3) DSH is the Medicare and Medicaid disproportionate share hospital payments for hospitals that receive disproportionately large Medicare and Medicaid patients. 4) Other includes reduce Medicaid administrative costs, increase nominal Medicaid copays, cut Medicare payments for bad debt, increase cost Sharing for federal civilian retirees and place dual-eligible individuals in Medicaid Managed Care. Source: National Commission on Fiscal Responsibility and Reform, KP “The Moment of Truth: Report of the National Commission on Fiscal Responsibility and Reform,” 12/1/10. www.kpcb.com USA Inc. | What Might a Turnaround Expert Consider? 327 Restructure Medicare & Medicaid: Long-Term Policy Options From the Report of the National Commission on Fiscal Responsibility and Reform e Set global target for total federal health expenditures after 2020 (Medicare, Medicaid, CHIP, exchange subsidies, employer health exclusion), and review costs every two years. Keep federal health expenditure growth to one percentage points above GDP growth. e If costs have grown faster than targets (on average of previous 5 years), require President to submit and Congress to consider reforms to lower spending, such as: — Increase premiums (or further increase cost-sharing) Overhaul the fee-for-service system — Develop a premium support system for Medicare Add a robust public option and/or all-payer system in the exchange — Further expand authority of the Independent Payment Advisory Board (IPAB)* Note: IPAB is a 15-member Independent Payment Advisory Board established under PPACA with significant authority with respect to Medicare payment rates. Beginning in 2014, in any year in which the Medicare per capita growth rate exceeded a target growth rate, the PAB would be required to recommend Medicare spending reductions. The recommendations would become law unless Congress passed an alternative proposal that achieved the same level of budgetary savings. Source: National Commission on Fiscal Responsibility and Reform, “The Moment of Truth: Report of the National Commission on Fiscal KP Responsibility and Reform,” 12/1/10. (@E) www.kpcb.com USA Inc. | What Might a Turnaround Expert Consider? 328 HOUSE_OVERSIGHT_021005
Page 183 - HOUSE_OVERSIGHT_021006
Focus on Expenses— Reform Entitlement Programs + Focus on Operating Efficiency Focus on Expenses Review Federal Wages & Benefits Review Government Pension Plan Characteristics & Compare with Private Sector Plans Review Role of Unions Focus on Operating Review Government Cost Structure & Efficiency Consider Reducing Federal Headcount Determine if There are Non-Core ‘Business Lines’ That Can Be Centralized / Locally Out-Sourced KP www.kpcb.com USA Inc. | What Might a Turnaround Expert Consider? 329 Start with the Basic High-Level Math — Review Government Cost Structure Government (federal + state + local, including military) spending per household has steadily risen to 82% of median post-tax household income, up from 51% in 1967. Federal spending (ex. entitlement + interest payments + one-time items) per household has remained flat since 1967, while entitlement + interest payments + one-time items spending per household rose 3x. Including federal, GSE, state and local (excluding military) employees, there is one public worker for every six households in the country, unchanged from 1967 or 1980 levels. Note: *Real spending adjusted for inflation, in 2005 dollars. Source: Census Bureau, Bureau of Economic Analysis. (@E) www.kpcb.com USA Inc. | What Might a Turnaround Expert Consider? 330 HOUSE_OVERSIGHT_021006
Page 184 - HOUSE_OVERSIGHT_021007
Total Government (Federal + State + Local, including Military) Spending Has Risen to 82% of Median Household Income”*, Up from 51% in 1967 Real USA Government Spending per Household and as Percent of Post-Tax Median Annual Household Income, 1967 — 2010 $50,000 ----------- === += 22222 ee eee eee eee 100% $40,000 $30,000 60% $20,000 $i a it TELE LLL ao, of Median Household Income (%) $10,000 | at it SEE EELELLD oxo, Total Government Spending per Household ($) Government Spending per Household as % $0 0% 1967 1970 1973 1976 1979 1982 1985 1988 1991 1994 1997 2000 2003 2006 2009 mam Real Government (Federal+State+Local) Spending per Household ($) —— Government Spending per Household as % of Median Household Income (%) Note: *Post tax. Real spending adjusted for inflation using BEA’s GDP price index, in 2005 dollars. Data source: Census Bureau, P Bureau of Economic Analysis. (@)E) www.kpcb.com USA Inc. | What Might a Turnaround Expert Consider? 331 Federal (Including Military) Spending Has Risen to 65% of Median Household Income”, Up from 39% in 1967, Driven by Entitlement Spending + Interest Payments Real USA Federal Spending per Household and as Percent of Post-Tax Median Household Income, 1967 — 2010 $40,000 ---------------- 2-222 222 e eee nee ee ee ee eee ee eee een eee eee 70% 60% $30,000 -------------- ++ - 22 nee neen mg - 50% 40% | ae : E E p l | i | Tait I 30% 209 $10,000 - Hild ! : 4 | | i { ll I WEEE l i) 10% $0 T T T T T T T T T 0% 1967 1970 1973 1976 1979 1982 1985 1988 1991 1994 1997 2000 2003 2006 2009 man Entitlement / Interest Payments / One-Time Real Federal Spending per Household mam Real Federal Spending per Household (ex. Entitlement / Interest Payments / One-Time Items) —— Federal Spending per Household as % of Median Household Income (%) Federal Spending per Household ($) Federal Spending per Household as % of Median Household Income (%) Note: *Post tax. Real spending adjusted for inflation, in 2005 dollars. Data source: White House Office of Management and KP Budget, Census Bureau, Bureau of Economic Analysis. (@E) www.kpcb.com USA Inc. | What Might a Turnaround Expert Consider? 332 HOUSE_OVERSIGHT_021007
Sponsored
Page 185 - HOUSE_OVERSIGHT_021008
Federal (Including Military) Spending Per Household = $29,043 in F2010 Federal Entitlement Spending Per Household = More Than Half ($16,670) F2010 USA Inc. Expenses = F2010 USA Inc. Expenses Per . ousenold = ‘ $3.5T Household = $29,043 Net Interest : ; Payment Discretiona ; One-Time Weg Entitlements $16,670 $152B Social Security $5,939 —— Medicare + Federal Medicaid $6,087 Discretionary / $431B os Unemployment Insurance + Other $4,644 Defense $5,828 Non-Defense Discretionary $3,619 care + Defense Discretionary One-Time Items $1,277 $694B Net Interest Payments $1,649 Unemployment Insurance + Other Entitlements $553B Note: Non-defense discretionary spending includes infrastructure, education, law enforcement, etc. Discretionary one-time items includes TARP, K ARRA, and spending on GSEs. Source: White House Office of Management and Budget, Census Bureau, Bureau of Economic Analysis. www.kpcb.com USA Inc. | What Might a Turnaround Expert Consider? 333 At a High Level, With Focus on Improving Operating Efficiency, USA Inc. Might Consider Ways to Do Things Like... e Consider empowering an independent / 3 party auditor with expertise in government operations around the world / corporate turnarounds to conduct a broad-ranging audit of USA Inc.’s operations. e Restore strong rules for budget process: Require annual budget resolutions and reconciliation; PAYGO* to limit spending, enforce annual appropriations process consider biennial budgeting. e Consider giving the President ‘line-item’ veto / rescission authority. e Empower commissions analogous to the military base closing panels to review and consolidate government functions and agencies, as well as aid to State and local governments. e Seek flexibility to manage performance and terminate poor-performing Federal employees. e Develop flexible / long-term compensation plans including bonus payments for Federal employees when annual budget deficit reduction goals are met. e Privatize government real estate and other assets with little use, expanding on current efforts to trim $3 billion in government-owned real estate. e Identify additional opportunities to increase public/private investment, management and operations to drive innovation and investment in infrastructure Note: PAYGO is the practice of financing expenditures with funds that are currently available rather than borrowed. KP Source: KPCB and Alvarez & Marsal Public Sector Services, LLC. (@E) www.kpcb.com USA Inc. | What Might a Turnaround Expert Consider? 334 HOUSE_OVERSIGHT_021008
Page 186 - HOUSE_OVERSIGHT_021009
Focus on Expenses if D bs www.kpcb.com Review Wages: A Comprehensive / Independent Review of Federal Wages & Benefits System May Be Worthwhile Analysis of existing data on federal wages & benefits is controversial. USA Today and the Cato Institute examined simple averages of federal (excluding military) wages & benefits vs. private sector using Bureau of Economic Analysis (BEA) data and concluded that federal wages & benefits are ~100% higher than private industry — wages are 58% higher while benefits are 3x higher.’ (March 2010, updated in August 2010) The White House Office of Management and Budget (OMB) and the U.S. Office of Personnel Management (OPM) responded that gross average comparisons are ‘unfair and untrue.’ And when one holds education and age constant, federal employees earn slightly less than those in the private sector on average, although the difference is not statistically significant.2 (March 2010) The Heritage Foundation, in response to OPM and OMB’s comments, released a statistical analysis based on BEA data, and claimed that adjusting for variables such as age, education, marital status, race, gender, size of the metropolitan area, and several others, federal wages & benefits are 31% higher than private industry for occupations in both government and private sector.? (July 2010) Source: 1) Dennis Cauchon, USA Today, “Federal Workers earning double their private counterparts,” http:/;www.usatoday.com/money/economy/income/201 0-08- 10-1Afedpay10_ST_N.hitm Tad DeHaven, “Federal Employees Continue to Prosper,” http://www.cato-at-liberty.org/federal-employees-continue-to-prosper/, 2) John Berry, “OPM Statement on Federal Employee Pay — Recent Comparisons of Federal Pay to Private Sector are Unfair and Untrue,” http:/www.opm.gov/opm_federalemployeepay/ & Peter Orszag, “Salary Statistics,” http:/;www.whitehouse.gov/omb/blog/1 0/03/10/Salary-Statistics; 3) James Sherk, (@ 2) www.kpcb.com “Comparing Pay in the Federal Government and the Private Sector,” http://www. heritage.org/research/reports/201 0/07/comparing-pay-in-the-federal-government- and-the-private-sector HOUSE_OVERSIGHT_021009 USA Inc. | What Might a Turnaround Expert Consider? 335 USA Inc. | What Might a Turnaround Expert Consider? 336
Page 187 - HOUSE_OVERSIGHT_021010
Review Wages: A Turnaround Expert Would Drill Down on Compensation Differences Between Public & Private Sectors e In the absence of reliable, generally accepted adjustment factors, USA Inc. needs a comprehensive 3-party review of its compensation practices. e Most businesses constantly review their compensation practices; these reviews typically intensify when the financials of the core business erode. e Considerations include compensation for comparable jobs, uniqueness of skill sets and education required for particular roles, productivity, hours worked, regional cost of living, job security, years of service, and financial health of the business unit. Pau bs www.kpcb.com USA Inc. | What Might a Turnaround Expert Consider? 337 Focus on Expenses CB www.kpcb.com USA Inc. | What Might a Turnaround Expert Consider? 338 HOUSE_OVERSIGHT_021010
Sponsored
Page 188 - HOUSE_OVERSIGHT_021011
Review Pension Plans: 70% of Federal Government Employees Still Enjoy “Guaranteed” Pensions, While Such Defined-Benefit Pension Plans Are Increasingly Rare in Private Sector (now at 32% vs. 84% in 1980) Employees with Guaranteed Pensions (% Participating in Defined Benefit Pensions) Federal Government vs. State & Local Government vs. Private Sector, 1980-2007 OO eee ee ee, — =State & Local Government Federal Government Private Sector % Employees w/ Guaranteed Pension 20% 0% . T T T T T T T T T T T T T T T T T T T T T T T T T T T 1 1980 1985 1990 1995 2000 2005 KP Sources: EBRI Databook on Employee Benefits. www.kpcb.com USA Inc. | What Might a Turnaround Expert Consider? 339 Review Pension Plans: Private Sector Has Embraced “Defined Contribution” Pension Plans, While Federal + State & Local Governments Lag Behind Participation Rate of Defined Contribution Program: Federal, State/Local vs. Private Sector, 1980-2007 c BOY ” c wv a 3 = Private Sector 2 & c fo) Be MES, = 2 eer ene ame eens mens mi en eH YC HS CB Se I FS = Federal a w Government £8 oo £ = & 2 2 20% ------------ 9-2 ng Tee = = —< =State /Local 5 rn a Government a — ” 0) w = = a ce ‘a £& uw i} o 0% a a se a | ~ 1984 1989 1994 1999 2004 KP Sources: EBRI Databook on Employee Benefits www.kpcb.com USA Inc. | What Might a Turnaround Expert Consider? 340 HOUSE_OVERSIGHT_021011
Page 189 - HOUSE_OVERSIGHT_021012
Review Pension: Pension Plan Definitions / Characteristics e “Guaranteed” Pension Plan — Retirees receive predetermined monthly retirement benefits from employers despite the funding status / investment returns of their pension funds. Also known as defined benefit pension plan. e Defined Contribution Pension Plan — Retirees contribute specified amounts to their pension funds and receive variable monthly retirement benefits depending on investment returns. Examples include Individual Retirement Accounts (IRAs) and 401(k) plans. Fae bs www.kpcb.com USA Inc. | What Might a Turnaround Expert Consider? 341 Focus on Expenses bs www.kpcb.com USA Inc. | What Might a Turnaround Expert Consider? 342 HOUSE_OVERSIGHT_021012
Page 190 - HOUSE_OVERSIGHT_021013
Review Unions: Government Employee Union Membership Rate = 5x of Private Sector Union Membership Rate & Rising e More government (federal / state / local) employees belong to unions (8 million) than did private sector employees (7 million) in 2009. e Government employee union membership rate of 37% is 5x higher than private sector employee union membership rate of 7% in 2009. e Private sector union membership rate declined 180 basis points to 7% in 2009 from 9% in 2000, while government employee union membership rate rose 50 basis points 37.4% in 2009 from 36.9% in 2000. KP Source: Bureau of Labor Statistics. www.kpcb.com USA Inc. | What Might a Turnaround Expert Consider? 343 Review Unions: Union Membership Rates by Industry — Government = 37% Unionized vs. Private Sector’s 2-22% Union Membership Rates by Industry, 2000 - 2009 2009 Union Members (000) — ee eo ”,”—o Government 8,407 ——Transportation & Utilities 1,04 30% ---------------------------- +--+ == +--+ == 5-5-5585 —— Construction 826 : Manufacturing 1 257 a a —— Information 275 $ — Mining 58 F — Education & Health 1,664 F ——Wholesale & Retail 1,056 5 _ —Leisure 403 Other 154 —— Business Services 379 0% = Finance 138 2000 2001 2002 2003 2004 2005 2006 2007 2008 2009 KP Source: Bureau of Labor Statistics. www.kpeb.com USA Ine. | What Might a Turnaround Expert Consider? 344 HOUSE_OVERSIGHT_021013
Sponsored
Page 191 - HOUSE_OVERSIGHT_021014
Focus on Expenses Fae bs www.kpcb.com USA Inc. | What Might a Turnaround Expert Consider? 345 Consider Reducing Federal Headcount Federal government headcount (ex. military) grew by 56,000 (or 2%) in 2008 and another 107,000 (or 3%) in 2009, while private sector unemployment rose to 10% from 5% in 2007 and private sector headcount fell 1% in 2008 and 6% in 2009. “DI . Source: Census Bureau, Bureau of Economic Analysis. bs www.kpcb.com USA Inc. | What Might a Turnaround Expert Consider? 346 HOUSE_OVERSIGHT_021014
Page 192 - HOUSE_OVERSIGHT_021015
Federal Headcount Has Risen Over Past Five Years and Is Above Trendline Level Federal Civilian Headcount & Share of Total Employment, 1988 - 2009 2,500 ~ 62-5 3 we ee ee ee ee ei ‘sammm Federal Civilian Full-Time Equivalent Employees -- 2.5% ——% Share of Total Employment (right axis) a) wo g — — Federal Civilian Headcount Linear Trendline 2 = 2,000 - -_ pine Ses — Hos eee es RO TER ahs He ibs A em ats te — 2.0% Lu 7S l c Soe = 5 1,500 - OR EeOeaei eee Ee == 2 -- 1.5% > ia _~ ~300K a #2 Potential iS Eo Ww a Headcount = e ‘ £ S 1,000 - si fs -a--i ia --e -e- — -~ Seton 1.0% pd LL _ c ° & x 2 oO = 500 - in fs > ia: pe RE BBS coe 2 mi mo 0.5% c oO i) 3 wa WL 0 T T T T T T T T T T T T T T T T T T T T 1 0.0% 1988 1990 1992 1994 1996 1998 2000 2002 2004 2006 2008 2010 2012 2014 KP Data source: BEA (1988-2009). i USA Inc. | What Might a Turnaround Expert Consider? 347 Reduce Headcount: Mathematical Illustration on Reducing Federal Headcount — Could Save Up to $275 Billion Over Next 10 Years, or 4% of Total Deficit Scenario Analysis on Potential Federal Headcount Reduction & Impact on Budget Deficits Headcount Savings ($B) For USA Inc. Over Reduction F2009 F2010-19E F2010-85E (000) Scenario 1 -- Trim Headcount by 1% $2 $17 $44 20 % of Budget Deficits 0% 0% 0% Scenario 2 -- Trim Headcount by 5% $11 $91 $219 98 % of Budget Deficits 1% 1% 1% Scenario 3 -- Trim Headcount by 10% $23 $183 $439 195 % of Budget Deficits 2% 3% 3% Scenario 4 - Trendline* -- Trim Headcount by 15% % of Budget Deficits Note: Federal fiscal year ends in September. *Based on 20-year trend line, federal civilian headcount would have been 15% below actual levels. KP www.kpcb.com USA Inc. | What Might a Turnaround Expert Consider? 348 HOUSE_OVERSIGHT_021015
Page 193 - HOUSE_OVERSIGHT_021016
Focus on Expenses Pau bs www.kpcb.com USA Inc. | What Might a Turnaround Expert Consider? 349 Local Outsourcing/Consolidation: Improve Efficiency of Public Services Through Automation / Scale / Flexibility 1. Automation — Government agencies cannot afford to perform manual routine-based processes that can be replaced more efficiently by technology. 2. Scale — Consolidation of non-core processes across agencies or outsource non-core processes to local companies can deliver scale efficiencies. 3. Flexibility — Outsourced labor enables temporary employment in situations where hiring full-time workers would be costly and unnecessary. as Sources: Adam Frisch, Morgan Stanley Research. CB www.kpcb.com USA Inc. | What Might a Turnaround Expert Consider? 350 HOUSE_OVERSIGHT_021016
Sponsored
Page 194 - HOUSE_OVERSIGHT_021017
Local Outsourcing/Consolidation: Proven to Be Viable Cost-Cuiting Measures for State / Local Governments Public Sector Details 2002-2010 Mise Grate Digitized State Medicaid health record Government Port Authority of | E-ZPass (electronic toll collection) can process 1993-2010 New York and 2.5x to 3x more vehicles per lane than toll New Jersey attendants Automation Pennsylvania Consolidated office supplies + computer State Government procurement Dept. 2 2002-2004 Management Outsourced HR and supporting IT system to f local contractors Services, FL Health and . . 2004-2005 Hunan services Outsourced HR, payroll and enterprise service ae center to private vendors Commission, TX Outsourced police force to county sheriff in an Mayans, Oe effort to avoid bankruptcy Set up a Family Assistance Hotline within 10 days via an outsourcer (vs. 3-6 months doing it in-house) American Red Cross Note: 1) Annual Budget of the year when outsourcing program started. Sources: HR Outsourcing in Government Organizations, The Conference Board; Outsourcing Methods & Case Studies, 2009; Maywood, CA data per The Economist. PA state government data per Ed Rendell, Governor of Pennsylvania. ) E-ZPass per E- KP Zpass New Jersey Customer Service Center, Missouri Medicaid case study per ACS; American Red Cross per Tholons, Government Sector Outsourcing. (@)E) www.kpcb.com USA Inc. | What Might a Turnaround Expert Consider? 351 Focus on Operating Efficiency — Policy Options From National Commission on Fiscal Responsibility and Reform Co-Chairs’ Proposal KP www.kpcb.com USA Inc. | What Might a Turnaround Expert Consider? 352 HOUSE_OVERSIGHT_021017
Page 195 - HOUSE_OVERSIGHT_021018
Focus on Operating Efficiency: Illustrative Policy Options From the Report of the National Commission on Fiscal Responsibility and Reform Illustrative Policy Options Deficit Reduction in F2015E Eliminate 250,000 non-defense service and staff augmentee contractors $18 billion Eliminate all earmarks' $16 Freeze federal salaries, bonuses, and other compensation at non- $15 Defense agencies for three years Cut the federal workforce by 10% (2-for-3 replacement rate) $13 Create a Cut-and-Invest Committee charged with trimming waste and $11 targeting investment Slow the growth of foreign aid $5 Other? $22 Total Deficit Reduction F2015E $100 billion Note: 1) an earmark is a legislative (especially congressional) provision that directs approved funds to be spent on specific projects, or that directs specific exemptions from taxes or mandated fees. 2) Other includes eliminate NASA funding for commercial spaceflight, terminate low-priority Army Corps of Engineers programs, sell excess federal property, reduce congressional & White House budgets by 15%, reduce unnecessary printing costs and more. Source: National KP Commission on Fiscal Responsibility and Reform, “The Moment of Truth: Report of the National Commission on Fiscal Responsibility and Reform,” 12/1/10. (@)E) www.kpcb.com USA Inc. | What Might a Turnaround Expert Consider? 353 What Might a Turnaround Expert Consider? Focus on Expenses Reform Entitlement Programs Focus on Operating Efficiency (@E) www.kpcb.com Focus on Revenues Drive Sustainable Economic Growth Consider Changing Tax Policies USA Inc. | What Might a Turnaround Expert Consider? 354 HOUSE_OVERSIGHT_021018
Page 196 - HOUSE_OVERSIGHT_021019
Focus on Revenues — Drive Sustainable Economic Growth + Change Tax Policies Focus on Revenues Invest in Technology / Infrastructure / Education Drive Sustainable Economic Increase / Improve Employment SL Improve Competitiveness Consider Review Tax Rates Changing MEE Reduce Subsidies / Tax Expenditures*/ eee Broaden Tax Base Note: *Tax subsidies / expenditures are losses to the U.S. Treasury from granting certain deductions, exemptions, or credits (such i as those on mortgage interest payments and employer-sponsored health insurance payments) to specific categories of taxpayers. www.kpcb.com USA Inc. | What Might a Turnaround Expert Consider? 355 GDP Growth = Biggest Driver of Federal Revenue Growth...& 85% Correlation 1940 — 2009 Historical Correlation Between USA Real GDP Y/Y 2010E — 2019E & Real Federal Receipts Y/Y = 85% If Real Real Federal 60% | @ Real GDP Y/Y vs. Real Federal Receipts Y/Y 7 GDP Revenue ; ; YY is Could Grow... — -Linear Trendline (y=2.77x-0.0438, R42=0.73) 4 ” ee a 7 5% 7% = 7 4 5 = 40% - Z 7 a 3 2 2 7 ; 2 0 7 7 3 r 7 . 1 -2 ac Y 7 0 -4 @ Z 20% - 7 -1 -7 te eo 4 J 4 we P ¥ 2 9 a @ 7 -3 -11 w e e ¥ e -4, -13 38% ja 5% @ one 5% 40% 15% 20% 25% e Os € Current Consensus a 7 / GDP Forecasts 7 Real GDP Y/Y (%) 7 @ -20% — bs Data source: White House Office of Management & Budget (1940 — 2009). (@E) www.kpcb.com USA Inc. | What Might a Turnaround Expert Consider? 356 HOUSE_OVERSIGHT_021019
Sponsored
Page 197 - HOUSE_OVERSIGHT_021020
It’s Easy to Gripe About USA Inc.’s High Expense Levels... That Said, High Expenses Could be Covered by High Revenue e There are two primary drivers of USA Inc.’s revenue: 1) GDP growth and 2) related tax levies on consumers and businesses. e To bring its income statement mechanically to break-even for 2009 (excluding one- time charges), USA Inc. would have needed to raise individual income tax rates by ~2x across-the-board to an average of ~26-30% (from ~13%) of gross income.' This certainly seems draconian. And a tax increase of this nature would surely have a significant negative impact on USA’s GDP growth as consumers would have far less disposable income to buy goods and services. e This brings us to a key element of USA’s financial challenges — the need to drive economic (GDP) AND related job growth. This is not easy. A material portion of GDP growth over the past few decades was driven by rising consumption aided by rising leverage and we have now entered a period of de-leveraging. e Stronger economic growth would be hugely beneficial for USA Inc.’s revenues. But the legacy of the financial crisis - severe housing imbalances and the need to complete the long process of writing off private mortgage debt — means that the US recovery will probably remain slow for at least several years. The silver lining: A booming global economy should provide a modest lift to US growth. Note: 1) USA Inc.’s F2009 revenue shortfall was $997B (excluding one-time discretionary spending items). F2009 total income tax receipts from individuals were $915B. As a result, if one were to raise individual income tax rates alone to achieve [ financial break-even, one would have to more than double individual income tax rates across-the-board. www.kpcb.com ne. at Might a Turnaround Expert Consider? B kpeb USA Inc. | What Might a T dE Consider? 357 Drive Growth: If Real GDP Grows 0.1 Percentage Point Faster Than Current CBO Projection For F2011-F2020E, the Budget Deficit Could Shrink by 5% Without Other Policy Changes e CBO analysis shows that for every 0.1 percentage point (pps) increase in real GDP annual growth rate above CBO’s baseline estimate for F2011-F2020E, USA Inc.’s revenue (driven by taxes) could be $247 billion higher, spending could be $41 billion lower (driven by reduced welfare spending) and the budget deficit could be reduced by $288 billion, or 5%. CBO’s baseline What if real GDP : Deficit assumption for annual _— grows faster than Revende Spending Reduction real GDP growth CBO’s forecast by... ($B / %) ($B / %) ($B / %) +$247 -$41 -$288 eee +1% % 5% 2.1% F2011E +$1,235 -$205 -$1 ,440 ° EIeRe +3% --% -23% 4.4% F2012-14E ° 1 one +$2,470 -$410 -$2,880 2.4% F2015-20E pp +6% 1% -46% +$4,940 -$820 -$5,760 ZiRB= +13% 2% 92% Note: pps is percentage point(s). $ amount and % changes in revenue / spending / deficit are over the entire F2011-F2020E KP period. Source: CBO, “The Budget and Economic Outlook: Fiscal Years 2010 to 2020,” 8/10. (@E) www.kpcb.com USA Inc. | What Might a Turnaround Expert Consider? 358 HOUSE_OVERSIGHT_021020
Page 198 - HOUSE_OVERSIGHT_021021
How Much Would Real GDP Need to Grow to Drive USA Inc. to Break-Even Without Policy Changes? 6-7% in F2012E-F2014E & 4-5% in F2015- F2020E...Well Above 40-Year Average of 3% CBO’s Baseline Real GDP Growth vs. Required Real GDP Growth for a Balanced Budget Between F2011E and F2020E = = 2 £ oO = > a Q o 5 1 ac 200 2011E 2013E 2015E 2017E 2019E Uff ce = ee we cos ome ees ores ew 9 ame ee Ome = os er Ne Ss ES ee Se Gs es Se = Real GDP Annual Growth (CBO Baseline Forecast) Real GDP Annual Growth Needed to Eliminate Fiscal Deficit =— = 1970-2009 Average Real GDP Growth PAYff co = ows ee we es ome ees oes ew ae Oe = on ee Mee ce SE cE = ee GS Gs ee = K P Source: CBO, “The Budget and Economic Outlook: Fiscal Years 2010 to 2020,” 8/10. www.kpcb.com USA Inc. | What Might a Turnaround Expert Consider? 359 It’s Highly Unlikely That Annual Real GDP Can Grow Faster Than 6%... It Happened Only 8 Times in Past 60 Years and Was Always Linked to a Cyclical Bounce Back CBO’s Baseline Real Annual GDP Growth vs. Required Real Annual GDP Growth for a Balanced Budget Between F2011E and F2020E in Historical Context (1950-2020E) Real GDP Y/Y Growth (%) 1950 1960 1970 1980 1990 2000 2010E 2020E Real GDP Annual Growth (Historical) Real GDP Annual Growth (CBO's Baseline Forecast) = =Real GDP Annual Growth Needed to Eliminate Fiscal Deficit Source: CBO, “The Budget and Economic Outlook: Fiscal Years 2010 to 2020,” 8/10. P (@E) www.kpcb.com USA Inc. | What Might a Turnaround Expert Consider? 360 HOUSE_OVERSIGHT_021021
Page 199 - HOUSE_OVERSIGHT_021022
USA Consumers = Biggest Demand Driver For GDP Growth, Until 2007 Personal Consumption’s Contribution to Real GDP Growth, 1950 - 2009 = 4% = £ (0) = 2% ~~ > a a (0) rt 0% wo a ay, m@ Real GDP Y/Y Growth 71) a re Personal Consumption Expenditure’s Contribution to Real GDP Growth BAY So — cen ee ae os a a eee eS = RE a Se = eR eS SO = a 1980 1982 1984 1986 1988 1990 1992 1994 1996 1998 2000 2002 2004 2006 2008 KP Source: BEA. (@)E) www.kpcb.com USA Inc. | What Might a Turnaround Expert Consider? 361 Beginning in 2007, Wealth Destruction + High Unemployment Forced Consumers to Save Again, Potentially Reducing Short-Term Demand for Goods & Services 3% average annual GDP growth (1981 - 2007) was helped as the average USA consumer: 1) Increased personal consumption as percent of GDP to 71% from 62%; 2) Decreased personal savings rate to 2% of disposable income from 11%; Beginning in 2007, things changed as: 1) The average US consumer experienced a material decline in the value of his / her largest investment assets (real estate and equities) from 2007 to 2009 when peak-to-trough valuations for USA residential real estate declined 30% and the S&P 500 declined 56%; 2) Unemployment rose to 10% in 2009 / 2010 from 30-year trough of 4% in 1999, creating uncertainty regarding future personal income levels; 3) Personal savings rate increased to 6% in 2009 / 2010 of disposable income from 2% in 2007, as uncertainty grows and appetite for consumption ebbs; All in, the key driver of US GDP growth — the US consumer’s ability to spend — is severely constrained in the short term as he / she aims to rebuild savings and contain spending. This raises the question — ‘How fast can US GDP grow annually over the next ten years?’ Determining ways to drive GDP (and related job growth) is crucial... Source: Residential real estate decline based on CQ1:07 to CQ1:09 changes in S&P Case-Shiller Home Price Index. GDP KP growth & composition / personal savings rate per BEA. Unemployment rate per BLS. www.kpcb.com USA Inc. | What Might a Turnaround Expert Consider? 362 HOUSE_OVERSIGHT_021022
Sponsored
Page 200 - HOUSE_OVERSIGHT_021023
Economic Policy—Short-Term vs. Long-Term ¢ Economic theory + experience of the Great Depression suggest government can use fiscal policy (increase direct spending + investment) to offset near-term shortfalls in private demand. ¢ In the long term, USA Inc. cannot sustain higher levels of direct spending / investment without crowding out private consumption / investment. ¢ Therefore, USA Inc. should prioritize and allocate available resources to stimulate growth in productivity + employment, which drive long-term GDP growth. www.kpcb.com USA Inc. | What Might a Turnaround Expert Consider? 363 Improving Employment, Productivity, & Hours Worked Are Source of Sustainable Long-Term GDP Growth USA Long-Term GDP Growth' (1970-2009) 2.83% Hours Worked Per Worker -0.22% Has Been Consistent At ~39-40 Hours per Week Note: 1) all growth numbers are rounded average annual growth rates and are adjusted for inflation. 2.83% is the average annual GDP growth rate from 1970 to 2009, per BEA. Labor force growth of 1.53% is the average annual growth rate from 1970 to 2009, per BLS. Hours worked per worker per OECD. Productivity growth of 1.53% is calculated by subtracting employment growth and hours worked per worker growth from real GDP growth. Average annual growth rate of 1.53% is roughly in line with other estimates such as Dale W. Jorgenson, Mun S. Ho, Kevin J. Stiroh, “Growth of U.S. Industries and Investments in Information Technology and Higher Education” <hitp:/Avww.nber.org/chapters/c1 0627> (@ www.kpcb.com USA Inc. | What Might a Turnaround Expert Consider? 364 HOUSE_OVERSIGHT_021023
Entities Mentioned
AF
Adam Frisch
PERSON
American politician (born 1967)

Ben Bernanke
PERSON
American economist (born 1953)
BG
Betsy Graseck
PERSON
Name reference in documents
Carmen Reinhart
PERSON
American economist
Dale W. Jorgenson
PERSON
American economist

David Lovett
PERSON
Name reference in documents
DS
David Studdert
PERSON
Health policy and legal researcher
DC
Dennis Cauchon
PERSON
Name reference in documents
Doug Simpson
PERSON
Name reference in documents

Douglas Elmendorf
PERSON
American economist

Drill Down
PERSON
Name reference in documents

Ed Rendell
PERSON
Governor of Pennsylvania from 2003 to 2011

ee ee lg =
PERSON
Name reference in documents
ES
ee Mee ce SE
PERSON
Name reference in documents

ees Ses
PERSON
Name reference in documents
EF
Elliott S. Fisher
PERSON
Name reference in documents
EF
Eric A. Finkelstein
PERSON
American economist

Eric Trump
PERSON
American businessman and reality television personality (born 1984)
FL
Flemming
PERSON
Name reference in documents

George W. Bush
PERSON
President of the United States from 2001 to 2009

Ghislaine Maxwell
PERSON
British socialite and sex trafficker, daughter of Robert Maxwell, accomplice of Jeffrey Epstein

James Baker
PERSON
American lawyer and statesman (born 1930)
JS
James Sherk
PERSON
Name reference in documents

Joel W. Cohen
PERSON
Name reference in documents

John D. Rockefeller
PERSON
Person referenced in documents

John Goodman
PERSON
American actor

John Kerry
PERSON
American politician and diplomat (born 1943)
Jon Meliones
PERSON
Name reference in documents

Justin G. Trogdon
PERSON
Name reference in documents

Justin Trudeau
PERSON
23rd prime minister of Canada from 2015 to 2025

Kenneth Rogoff
PERSON
Economist and chess player

Kevin J. Stiroh
PERSON
Economist (Federal Reserve Bank of New York)

Laura Barlow
PERSON
Curator

Lawrence Krauss
PERSON
American particle physicist and cosmologist
LC
Lawrence P. Casalino
PERSON
Name reference in documents
LA
LLL ao
PERSON
Name reference in documents
LG
Louis Gerstner
PERSON
Printer and owner of a graphical business in Leipzig, Germany, 1886-

Louis V. Gerstner Jr.
PERSON
American businessman (born 1942)
ME
Medpac
PERSON
Name reference in documents
MF
Melissa M. Favreault
PERSON
Name reference in documents

Michael Cohen
PERSON
American former attorney and former Republican official

Michael Douglas
PERSON
American retired actor, producer and activist (born 1944)
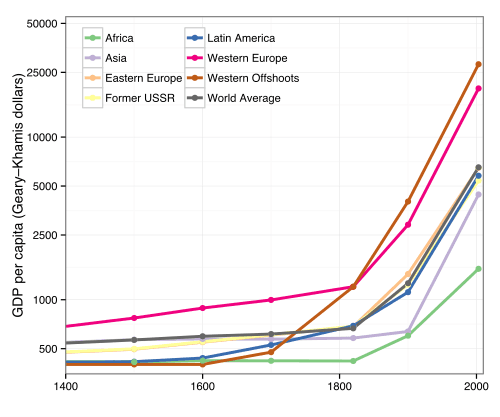
Mun S. Ho
PERSON
Ph.D. Harvard University 1989

nee neen mg -
PERSON
Name reference in documents

Nene es Se
PERSON
Name reference in documents
NW
Net Worth
PERSON
Person referenced in documents
NT
ng Tee
PERSON
Name reference in documents

Orrin G. Hatch
PERSON
American politician (1934–2022) – Former United States Senator and Former President Pro Tempore of the United States Senate (2015-2019)

OS Su Sa
PERSON
Name reference in documents

Peter Orszag
PERSON
American economist and Chairman & CEO of Lazard

Reinhart
PERSON
Refers to Bruce Reinhart, former federal prosecutor who became Palm Beach County judge in Epstein case
RF
Richard Foster
PERSON
Scottish association football player (born 1985)

Richard Sloma
PERSON
Name reference in documents

Richard W. Johnson
PERSON
Name reference in documents

Risen Faster
PERSON
Name reference in documents

Robert Shiller
PERSON
Indian choreographer

Rogoff
PERSON
Surname or name fragment in documents

Samantha Power
PERSON
Irish-American academic, author and diplomat
SE
Seton
PERSON
Name reference in documents

Stephen Hawking
PERSON
British theoretical physicist, cosmologist and author (1942–2018)
SS
Stephen Shortell
PERSON
Researcher (ORCID 0000-0002-7392-9801)
SS
Stuart Slatter
PERSON
Name reference in documents

Timothy Geithner
PERSON
American central banker and politician

Vince Foster
PERSON
American lawyer (1945-1993)
WD
William Dietz
PERSON
American obesity researcher (born 1944)

Would Drill Down
PERSON
Name reference in documents
0.8x Total USA Household
ORGANIZATION
Organization referenced in documents
3.8x S&P500 Total Market Capitalization
ORGANIZATION
Organization referenced in documents
a USA Inc. ‘
ORGANIZATION
Organization referenced in documents
a Volatile Malpractice Environment
ORGANIZATION
Organization referenced in documents
Accountable Care Organizations
ORGANIZATION
Organization referenced in documents
Age Group
ORGANIZATION
Organization referenced in documents
All Healthcare Plans
ORGANIZATION
Organization referenced in documents
Alvarez & Marsal Public Sector Services
ORGANIZATION
Organization referenced in documents
American Hospital Association
ORGANIZATION
Organization referenced in documents
American Medical Association
ORGANIZATION
Organization referenced in documents

American Red Cross
ORGANIZATION
National Red Cross Society in the United States
aNet Medicare
ORGANIZATION
Organization referenced in documents
Army Corps of Engineers
ORGANIZATION
Indian Army functional command responsible for military engineering
ASUS Fannie Mae +
ORGANIZATION
Organization referenced in documents
Automation / Scale / Flexibility
ORGANIZATION
Organization referenced in documents
B kpeb USA Inc.
ORGANIZATION
Organization referenced in documents
Baseline Real GDP Growth
ORGANIZATION
Organization referenced in documents
Bend Points
ORGANIZATION
Organization referenced in documents
Beneficiaries & Services
ORGANIZATION
Organization referenced in documents
BGG wc - mee
ORGANIZATION
Organization referenced in documents

Budget
ORGANIZATION
Car rental company

Bureau of Labor Statistics
ORGANIZATION
US government agency
Business Services
ORGANIZATION
Organization referenced in documents
Calculated Risk
ORGANIZATION
Organization referenced in documents

Castlight Health
ORGANIZATION
US healthcare navigation company
CBO Forecasts
ORGANIZATION
Organization referenced in documents
CBO Long-Term Budget Outlook
ORGANIZATION
Organization referenced in documents
CBO Paper
ORGANIZATION
Organization referenced in documents
CBO Policy Options
ORGANIZATION
Organization referenced in documents
CBO Projection
ORGANIZATION
Organization referenced in documents
Centers for Medicare & Medicaid Services
ORGANIZATION
Organization referenced in documents
Children’s Health Insurance Program
ORGANIZATION
Organization referenced in documents

Chrysler
ORGANIZATION
American automotive manufacturer
Chrysler Suppliers
ORGANIZATION
Organization referenced in documents

Citibank
ORGANIZATION
American multinational bank
Clerical Workers
ORGANIZATION
Organization referenced in documents

Cleveland Clinic
ORGANIZATION
Organization referenced in documents
Combination of Reducing Benefits
ORGANIZATION
Organization referenced in documents
Commonwealth of Massachusetts 4
ORGANIZATION
Organization referenced in documents
Components of Healthcare System
ORGANIZATION
Organization referenced in documents

Congressional Research Service
ORGANIZATION
United States federal agency
Consumers & Housing
ORGANIZATION
Organization referenced in documents
Consumers & Small Businesses
ORGANIZATION
Organization referenced in documents
Corporate GAAP Accounting
ORGANIZATION
Organization referenced in documents
Declining Interest Rate
ORGANIZATION
Organization referenced in documents
Defense Programs
ORGANIZATION
Organization referenced in documents
Defensive Medicine
ORGANIZATION
Organization referenced in documents
Defined Benefit Pensions
ORGANIZATION
Organization referenced in documents

Deloitte
ORGANIZATION
Multinational professional services network founded in 1845
Deloitte Center for Health Solutions
ORGANIZATION
Organization referenced in documents
Department of Housing and Urban Development
ORGANIZATION
Organization referenced in documents
Dept. of
ORGANIZATION
Organization referenced in documents
di Services
ORGANIZATION
Organization referenced in documents
Direct Graduate Medical
ORGANIZATION
Organization referenced in documents

DOC Bureau of Economic Analysis
ORGANIZATION
Organization referenced in documents
Drive Sustainable Economic Growth + Change Tax Policies
ORGANIZATION
Organization referenced in documents
Drive USA Inc.
ORGANIZATION
Organization referenced in documents
EBRI Databook on Employee Benefits
ORGANIZATION
Organization referenced in documents
Economic Miracle
ORGANIZATION
Organization referenced in documents
Eligibility Group and Type of Service
ORGANIZATION
Organization referenced in documents
em Mac
ORGANIZATION
Organization referenced in documents
enn w= mn en we ns ene en a
ORGANIZATION
Organization referenced in documents
Entitlement / Interest Payments
ORGANIZATION
Organization referenced in documents
EPSDT
ORGANIZATION
Organization referenced in documents
Examine USA Inc.
ORGANIZATION
Organization referenced in documents

FactSet
ORGANIZATION
American financial data company
Fannie + Freddie RMBS
ORGANIZATION
Organization referenced in documents
Fannie Mae / Freddie Mac Residential Mortgage-Backed Securities Issuance
ORGANIZATION
Organization referenced in documents
Fannie Mae + Freddie Mac’s
ORGANIZATION
Organization referenced in documents
Federal + State & Local Governments
ORGANIZATION
Organization referenced in documents
Federal Civilian Full-Time Equivalent Employees
ORGANIZATION
Organization referenced in documents
Federal Disability Insurance Trust Funds
ORGANIZATION
Organization referenced in documents
Federal Employee & Veteran Benefits Payable
ORGANIZATION
Organization referenced in documents
Federal Employees Continue
ORGANIZATION
Organization referenced in documents
Federal Employees Health Benefits
ORGANIZATION
Organization referenced in documents
Federal Government Employees
ORGANIZATION
Organization referenced in documents
Federal Medicaid
ORGANIZATION
Organization referenced in documents
Federal Poverty Levels
ORGANIZATION
Organization referenced in documents

Federal Reserve
ORGANIZATION
Federal Reserve System, central banking system of the United States
Federal Revenue & Medicare / Medicaid Spending
ORGANIZATION
Organization referenced in documents
Federal Spending per Household
ORGANIZATION
Organization referenced in documents
Federal Workers
ORGANIZATION
Organization referenced in documents
Federal, State/Local
ORGANIZATION
Organization referenced in documents
FHFA Annual Report
ORGANIZATION
Organization referenced in documents
Financial Disconnect
ORGANIZATION
Organization referenced in documents
Financial Enterprises
ORGANIZATION
Organization referenced in documents
Financial Outlook
ORGANIZATION
Organization referenced in documents
Financial Report
ORGANIZATION
Organization referenced in documents
Fiscal COMMISSION Staff
ORGANIZATION
Organization referenced in documents
Fiscal Responsibility
ORGANIZATION
Organization referenced in documents
Fiscal Responsibility and Reform
ORGANIZATION
Organization referenced in documents
Focus on Improving Operating Efficiency
ORGANIZATION
Organization referenced in documents

Freddie Mac
ORGANIZATION
American government-sponsored enterprise
Freddie Mac Public Market Capitalizations
ORGANIZATION
Organization referenced in documents
Fundamental Financial Problem
ORGANIZATION
Organization referenced in documents

General Motors
ORGANIZATION
American multinational automotive company
gleeeahtadieeesienttehteieatentieaeetemieaieenieiaaiaaees, dake ¥7
ORGANIZATION
Organization referenced in documents
GM Suppliers
ORGANIZATION
Organization referenced in documents
Government Employee Union Membership Rate
ORGANIZATION
Organization referenced in documents
Government Spending per Household
ORGANIZATION
Organization referenced in documents
Government-Sponsored Enterprises
ORGANIZATION
Organization referenced in documents

Harvard Business Review
ORGANIZATION
Journal
Health & Human Services
ORGANIZATION
Organization referenced in documents
Health & Human Services Center for
ORGANIZATION
Organization referenced in documents
Health Affairs
ORGANIZATION
Organization referenced in documents
Health Indicators USA Median
ORGANIZATION
Organization referenced in documents
Health Maintenance Organization
ORGANIZATION
Organization referenced in documents
Healthcare Education & Incentives
ORGANIZATION
Organization referenced in documents
Healthcare Programs Facing USA Inc.
ORGANIZATION
Organization referenced in documents
Healthcare Service Payment
ORGANIZATION
Organization referenced in documents
Healthcare Service Providers
ORGANIZATION
Organization referenced in documents
Healthcare Spending
ORGANIZATION
Organization referenced in documents
Healthcare System
ORGANIZATION
Organization referenced in documents
High-Deductible Health Plan
ORGANIZATION
Organization referenced in documents
Historical
ORGANIZATION
Organization referenced in documents
Home Finance Act
ORGANIZATION
Organization referenced in documents
Home Ownership Rate
ORGANIZATION
Organization referenced in documents

Hospice
ORGANIZATION
Hospital
House Budget Committee
ORGANIZATION
Organization referenced in documents
Housing & Urban Development
ORGANIZATION
Organization referenced in documents
HS Soe aes eS
ORGANIZATION
Organization referenced in documents
Hybrid Weekly
ORGANIZATION
Organization referenced in documents
Implantable Cardioverter Defibrillator
ORGANIZATION
Organization referenced in documents
Improve USA Inc.’s
ORGANIZATION
Organization referenced in documents
Individual &
ORGANIZATION
Organization referenced in documents
Just Cut Government
ORGANIZATION
Organization referenced in documents
K ARRA
ORGANIZATION
Organization referenced in documents
K P Social Security Administration
ORGANIZATION
Organization referenced in documents
K P|
ORGANIZATION
Organization referenced in documents
Kaiser Family Foundation
ORGANIZATION
Organization referenced in documents
Kaiser/HRET Survey of Employer-Sponsored Health Benefits
ORGANIZATION
Organization referenced in documents
KP Data
ORGANIZATION
Organization referenced in documents
KP Government
ORGANIZATION
Organization referenced in documents
KP growth & composition
ORGANIZATION
Organization referenced in documents
KP Note
ORGANIZATION
Organization referenced in documents
KP Troubled Asset Relief Program
ORGANIZATION
Organization referenced in documents
KS Rm
ORGANIZATION
Organization referenced in documents
Laboratory & x-ray
ORGANIZATION
Organization referenced in documents
Latest Treasury
ORGANIZATION
Organization referenced in documents
Leading Corporate Turnaround
ORGANIZATION
Organization referenced in documents
Legal Forces
ORGANIZATION
Organization referenced in documents
Linear Trend
ORGANIZATION
Organization referenced in documents

Los Angeles Times
ORGANIZATION
American daily newspaper covering the Greater Los Angeles area
Magnetic Resonance Imaging
ORGANIZATION
Organization referenced in documents
Marshall &
ORGANIZATION
Organization referenced in documents
Mathematical Challenge Related to
ORGANIZATION
Organization referenced in documents
McKinsey Global institute
ORGANIZATION
Organization referenced in documents

Medicaid
ORGANIZATION
United States social health care program for families and individuals with limited resources
Medicaid Health
ORGANIZATION
Organization referenced in documents
Medicaid Optional
ORGANIZATION
Organization referenced in documents
Medicaid Spending
ORGANIZATION
Organization referenced in documents
Medical Technology Affect Healthcare Costs
ORGANIZATION
Organization referenced in documents
Medicare & Medicaid Services
ORGANIZATION
Organization referenced in documents
Medicare & Medicaid: Economic Factors
ORGANIZATION
Organization referenced in documents
Medicare Liability Improvement
ORGANIZATION
Organization referenced in documents
Medigap
ORGANIZATION
Organization referenced in documents
Medium-Term Policy Options
ORGANIZATION
Organization referenced in documents
Modify Insurance Eligibility
ORGANIZATION
Organization referenced in documents
Modify Premium
ORGANIZATION
Organization referenced in documents
Morgan Stanley Healthcare Research
ORGANIZATION
Organization referenced in documents
Morgan Stanley Research
ORGANIZATION
Organization referenced in documents
N N N N N N N N N
ORGANIZATION
Organization referenced in documents
Net Government
ORGANIZATION
Organization referenced in documents
Net Interest Payment
ORGANIZATION
Organization referenced in documents
Net Interest Payments Could Soar
ORGANIZATION
Organization referenced in documents
Non-Bank
ORGANIZATION
Organization referenced in documents
Non-Core ‘Business Lines’
ORGANIZATION
Organization referenced in documents
Non-Defense
ORGANIZATION
Organization referenced in documents
Non-Defense Discretionary
ORGANIZATION
Organization referenced in documents
noo com USA Inc.
ORGANIZATION
Organization referenced in documents
Obesity-Related Medical Costs
ORGANIZATION
Organization referenced in documents
OECD Averages
ORGANIZATION
Organization referenced in documents
OECD USA Ranking
ORGANIZATION
Organization referenced in documents
Open Access Healthcare Plans
ORGANIZATION
Organization referenced in documents
Optional Beneficiaries & Services
ORGANIZATION
Organization referenced in documents
os Unemployment Insurance + Other $
ORGANIZATION
Organization referenced in documents
Outputs Track Inputs
ORGANIZATION
Organization referenced in documents
Pennsylvania Consolidated
ORGANIZATION
Organization referenced in documents
People / Organizational Structure
ORGANIZATION
Organization referenced in documents
Percent of Total Population
ORGANIZATION
Organization referenced in documents
Percentage of Total Outlays
ORGANIZATION
Organization referenced in documents
Personal Savings Rates
ORGANIZATION
Organization referenced in documents
Peter G. Peterson Foundation
ORGANIZATION
Organization referenced in documents
Plant & Equipment
ORGANIZATION
Organization referenced in documents
Point Of Service
ORGANIZATION
Organization referenced in documents

Port Authority
ORGANIZATION
Spanish Port authority
PPIFs
ORGANIZATION
Organization referenced in documents
PPP Adj
ORGANIZATION
Organization referenced in documents
Preferred Provider Organization
ORGANIZATION
Organization referenced in documents
Private Sector Union Membership Rate & Rising
ORGANIZATION
Organization referenced in documents
Private Sector’s
ORGANIZATION
Organization referenced in documents
Productivity / Operations
ORGANIZATION
Organization referenced in documents
Projection
ORGANIZATION
Organization referenced in documents
Protected Securities
ORGANIZATION
Organization referenced in documents
Public-Private Investment Program
ORGANIZATION
Organization referenced in documents
RB AB
ORGANIZATION
Organization referenced in documents
Real Federal Spending
ORGANIZATION
Organization referenced in documents
Reduce Material Impact on USA Inc.’s
ORGANIZATION
Organization referenced in documents
Reduce Social Security Future
ORGANIZATION
Organization referenced in documents
Regulate Private Health Insurance Market
ORGANIZATION
Organization referenced in documents
Revende Spending Reduction
ORGANIZATION
Organization referenced in documents
RMBS Mai Freddie Mac
ORGANIZATION
Organization referenced in documents
Save Again
ORGANIZATION
Organization referenced in documents
Scale — Consolidation of non-core
ORGANIZATION
Organization referenced in documents
Short-Term Interest Rate
ORGANIZATION
Organization referenced in documents
Smallest Component
ORGANIZATION
Organization referenced in documents
Social Forces
ORGANIZATION
Organization referenced in documents

Social Insurance
ORGANIZATION
Government-sponsored social program
Social Insurance (Entitlement
ORGANIZATION
Organization referenced in documents
Social Security / Medicare
ORGANIZATION
Organization referenced in documents
Social Security Benefits
ORGANIZATION
Organization referenced in documents
Social Security Options
ORGANIZATION
Organization referenced in documents
Social Security Reform: Legal Analysis of Social Security Benefits Entitlement Issues
ORGANIZATION
Organization referenced in documents
Social Security Tax Rate
ORGANIZATION
Organization referenced in documents
Social Security Trust Fund
ORGANIZATION
Organization referenced in documents
Social Security’s
ORGANIZATION
Organization referenced in documents
Spending Type
ORGANIZATION
Organization referenced in documents
State & Local
ORGANIZATION
Organization referenced in documents
State & Local Government
ORGANIZATION
Organization referenced in documents
State Government
ORGANIZATION
Organization referenced in documents
Sustainable Long-Term GDP Growth
ORGANIZATION
Organization referenced in documents
Technology / Infrastructure / Education
ORGANIZATION
Organization referenced in documents
TEIN Level & Interest
ORGANIZATION
Organization referenced in documents
the ‘Financial Crisis’
ORGANIZATION
Organization referenced in documents
The American Recovery and Reinvestment Act
ORGANIZATION
Organization referenced in documents
the Board of Medicare Trustees
ORGANIZATION
Organization referenced in documents
The Budget and Economic Outlook
ORGANIZATION
Organization referenced in documents
the Cato Institute
ORGANIZATION
Organization referenced in documents
the Center for Medicare & Medicaid Innovation
ORGANIZATION
Organization referenced in documents
the Chained CPI
ORGANIZATION
Organization referenced in documents

The Conference Board
ORGANIZATION
Organization referenced in documents
the Doctor's Office
ORGANIZATION
Organization referenced in documents
the Federal Hospital Insurance
ORGANIZATION
Organization referenced in documents
The Federal Housing Finance Agency
ORGANIZATION
Organization referenced in documents
The Health Insurance Association of America
ORGANIZATION
Organization referenced in documents
the Healthcare Payment
ORGANIZATION
Organization referenced in documents
The Kaiser Foundation
ORGANIZATION
Organization referenced in documents
the Long-Term
ORGANIZATION
Organization referenced in documents
The Market for Medical Care: Why You Don’t Know the Price
ORGANIZATION
Organization referenced in documents
the National Commission on
ORGANIZATION
Organization referenced in documents
the Private Sector
ORGANIZATION
Organization referenced in documents
the Term Asset-Backed Securities Loan Facility
ORGANIZATION
Organization referenced in documents
the Treasury Dept
ORGANIZATION
Organization referenced in documents

the United States Government
ORGANIZATION • 2 mentions
United States federal government

The Urban Institute
ORGANIZATION
Organization referenced in documents
Tholons, Government Sector Outsourcing
ORGANIZATION
Organization referenced in documents
Total USA Inc.
ORGANIZATION
Organization referenced in documents
Transportation & Utilities
ORGANIZATION
Organization referenced in documents
TRICARE
ORGANIZATION
Organization referenced in documents
Trust Funds
ORGANIZATION
Organization referenced in documents
Turn Around USA Inc.’s
ORGANIZATION
Organization referenced in documents
Type & Maturity
ORGANIZATION
Organization referenced in documents
U.S. Congressional Budget Office
ORGANIZATION
Organization referenced in documents
U.S. Department of Health & Human Services
ORGANIZATION
Organization referenced in documents
U.S. Dept of Treasury
ORGANIZATION
Organization referenced in documents
U.S. Home Ownership Rate U.S. Interest Rate
ORGANIZATION
Organization referenced in documents
U.S. Personal Savings Rate Note
ORGANIZATION
Organization referenced in documents

U.S. Treasury
ORGANIZATION • 3 mentions
United States Department of the Treasury, executive department of the federal government
Unconstrained Access to Medical Technology
ORGANIZATION
Organization referenced in documents
Unfunded Social Security
ORGANIZATION
Organization referenced in documents
US Census Bureau
ORGANIZATION
Organization referenced in documents
USA Adult Obesity Levels
ORGANIZATION
Organization referenced in documents
USA Consumers
ORGANIZATION
Organization referenced in documents
USA Falls
ORGANIZATION
Organization referenced in documents
USA Federal Government
ORGANIZATION
Organization referenced in documents
USA Federal Net Debt Outstanding / Effective Interest Rates / Net Interest Payments
ORGANIZATION
Organization referenced in documents
USA Inc.'s
ORGANIZATION
Organization referenced in documents
USA Ine
ORGANIZATION
Organization referenced in documents
USA One-Time Charges
ORGANIZATION
Organization referenced in documents
USA Real Building Cost Index
ORGANIZATION
Organization referenced in documents
USA Real Home Price
ORGANIZATION
Organization referenced in documents
USA Real Home Price & Building Cost Indexes
ORGANIZATION
Organization referenced in documents
USA Residential Mortgage Origination
ORGANIZATION
Organization referenced in documents

USA Today
ORGANIZATION
American national daily newspaper
Wealth Destruction + High Unemployment Forced Consumers
ORGANIZATION
Organization referenced in documents
White House Office of Management and Budget, Census Bureau
ORGANIZATION
Organization referenced in documents
World Federation of Exchanges
ORGANIZATION
Organization referenced in documents
Y |40-yrCAGR|
ORGANIZATION
Organization referenced in documents
Y/Y 2005Y
ORGANIZATION
Organization referenced in documents
Y/Y Growth
ORGANIZATION
Organization referenced in documents
yp Reduction
ORGANIZATION
Organization referenced in documents
YTD GSE & ARRA
ORGANIZATION
Organization referenced in documents
Zpass New Jersey Customer Service Center
ORGANIZATION
Organization referenced in documents
AIME2
LOCATION
Location referenced in documents

Algeria
LOCATION
Country in North Africa

Bahrain
LOCATION
Country in the Persian Gulf

Ecuador
LOCATION
Sovereign state in South America
Gabon
LOCATION
Country on the Atlantic coast of Central Africa

Hungary
LOCATION
Country in Central Europe

Kuwait
LOCATION
Sovereign state in Western Asia
Maywood
LOCATION
City in Los Angeles County, California, USA

Nigeria
LOCATION
Sovereign state in West Africa
Rockford
LOCATION
County seat of Winnebago County, Illinois, United States
Uff ce =
LOCATION
Location referenced in documents

United Arab Emirates
LOCATION
Country in Western Asia

Venezuela
LOCATION
Country in South America
Statistics
Pages:100
Entities:362
Avg. OCR:90.2%
Sponsored