HOUSE_OVERSIGHT_020824_sub_003 - HOUSE_OVERSIGHT_021089
Document Information
Bates Range
HOUSE_OVERSIGHT_020824_sub_003 - HOUSE_OVERSIGHT_021089
Pages
66
Source
House Oversight Committee
Original Filename
USA_Inc.pdf
Document Content
Page 201 - HOUSE_OVERSIGHT_021024
Focus on Productivity & Employment Growth, Each of Which Accounts for ~50% of Long-Term Real GDP Growth e Investments in Technology / Infrastructure / Education Boost Productivity. — Newer technology improves efficiency of communication and lowers costs of providing goods and services. — Better infrastructure reduces transportation costs for input and output materials — Better education improves general labor quality and enables specialization for more efficiency. e Removing Restrictions / Uncertainties in Various Regulations Can Stimulate Private Employment. — Immigration does not reduce employment opportunities for US-born workers, per Federal Reserve study in 8/10. — Removing tax / regulatory uncertainty could help create hiring incentives for private industries. e Hours Worked per Worker Have Remained Steady at ~39-40 Hours per Week From 1970 to 2009 and Will Likely Remain Steady. Source: OECD, Dale W. Jorgenson, Mun S. Ho, Kevin J. Stiroh, “Growth of U.S. industries and Investments in Information Technology and Higher Education” http:/Avwww.nber.org/chapters/c1 0627, Federal Reserve. www.kpcb.com USA Inc. | What Might a Turnaround Expert Consider? 365 Focus on Revenues Invest in Technology / Infrastructure / Education Drive Sustainable Economic Increase / Improve Employment Growth = Improve Competitiveness Consider Review Tax Rates Sule EE Reduce Subsidies / Tax Expenditures*/ ee Ueiee Broaden Tax Base KP www.kpcb.com USA Inc. | What Might a Turnaround Expert Consider? 366 HOUSE_OVERSIGHT_021024
Page 202 - HOUSE_OVERSIGHT_021025
Technology + Infrastructure + Education Investments Drove ~90% of Labor Productivity Growth for Past ~30 Years Sources of USA Average Labor Productivity Growth, 1977-2000 = Technology Investment i Infrastructure & Other Investment 1 Education (Labor Quality) 1 Other (Total Factor Productivity) Average Annual Growth Rate (%) 0.0% 1977-1990 1990-1995 1995-2000 Note: Total Factor Productivity is the portion of output not explained by the amount of inputs used in production. Source: Dale W. Jorgenson, Mun S. Ho, Kevin J. Stiroh, “Growth of U.S. Industries and Investments in Information KP Technology and Higher Education” <http:/;www.nber.org/chapters/c10627> (@)E) www.kpcb.com USA Inc. | What Might a Turnaround Expert Consider? 367 However, USA Inc. Has Increasingly Allocated Resources Away from Productive Technology + Infrastructure + Education Investment / Spending Toward Less-Productive Entitlement Program Spending USA Real Federal Productive vs. Less-Productive Spending*, 1970-2009 100% 80% 60% 40% 20% % Share of Total Federal Spending 0% 1970 1974 1978 1982 1986 1990 1994 1998 2002 2006 Note: *Total spending exciudes one-time items (such as TARP / GSE / ARRA) for F2008 / F2009 data. Data source: White House Office of Management & Budget (1970-2009). www.kpcb.com ne. at Might a Turnaround Expert Consider? kpeb USA Inc. | What Might a T dE Consider? 368 HOUSE_OVERSIGHT_021025
Page 203 - HOUSE_OVERSIGHT_021026
Drive Growth: Technology Technology Improves Efficiency of Communication and Lowers Costs of Providing Goods and Services (@)E) www.kpcb.com USA Inc. | What Might a Turnaround Expert Consider? 369 Technology Has Driven Significant Wealth & Job Creation S&P 500 Sector Market Value Share, 1995 — 2010 1995 1996 1997 1998 1999 2000 2001 2002 2003 2004 2005 2006 2007 2008 2009 2010 Information Technology Financials Consumer Staples Health Care Energy Industrials Consumer Discretionary Utilities Materials Telecom Services S&P 500 Mkt Cap ($7) 9% 13 13 11 9 13 13 5 6 9 $5 12% 15 13 10 9 13 12 4 6 7 $6 12% 17 12 11 8 12 12 3 4 7 $8 18% 15 11 12 6 10 13 3 3 8 $10 29% 13 7 9 6 10 13 $12 21% 17 8 14 7 11 10 4 2 5 $12 18% 18 8 14 6 11 13 3 3 5 $10 14% 20 9 15 6 12 13 3 3 4 $8 18% 16% 15% 15% 17% 15% 20% 19% 21 21 21 22 18 13 15 16 11 10 9 9 10 13 12 12 13 13 13 12 12 15 12 11 6 7 9 10 13 13 11 11 11 12 11 11 12 11 10 10 11 12 11 11 8 8 10 10 3 3 3 4 4 4 4 4 3 3 3 3 3 3 3 4 3 3 3 4 4 4 3 3 SAP 500MKtCap (ST) $5 _-$6_—$8_$10_$12_$12_ $10 $8_$10 Sit _$i1 S13 sis se $10 $11 (@E) www.kpcb.com Note: 2010 data as of 12/31/10. Source: FactSet, Bloomberg. USA Inc. | What Might a Turnaround Expert Consider? 370 HOUSE_OVERSIGHT_021026
Sponsored
Page 204 - HOUSE_OVERSIGHT_021027
But USA Inc. Has Steadily Scaled Back Investment in Technology R&D Since the 1960s...the Good News is That Private Industry Has Picked Up Lots of Slack, So Far Total USA Technology Research & Development Spending as % of GDP by Funding Source, 1953 — 2008 = Other (Non-Profit / University / Other Government) = Private Industry = Federal Government 1% Total Technology R&D Spending as % of GDP QV 1953 1957 1961 1965 1969 1973 1977 1981 1985 1989 1993 1997 2001 2005 KI Source: National Science Foundation, Science and Engineering Indicators, 2008. www.kpcb.com USA Inc. | What Might a Turnaround Expert Consider? 371 For GDP Growth & Job Creation, It’s Key for Private Industry to Remain Incentivized to Invest in R&D As we contemplate our future, we must accept the fact that many of the assumptions under which business operated for the past 50 years no longer hold true...If we are committed to investing in ideas to improve — not just maintain — what we have and what we know, the United States will do more than just recover from this recession. We will emerge, once again, as a competitive, global powerhouse...lnnovation...accrues to countries in proportion to the quality and rigor of their educational systems...The future of every nation will be shaped by new ideas and creativity. These are the engines of future prosperity. — Paul Otellini, CEO, Intel Corporation, 2/10/09 Government targeted and ‘blue sky’ investment in technology (and defense) has led to crucial technology inventions for America — such as ARPANET / Internet (1970s) and Global Positioning System (1980s)..., which, on a net basis, have created jobs, wealth and related tax revenue. Government investment in technology remains important, but, perhaps more important, government must help incentivize private industry (via tax policies such as allowing companies to repatriate overseas cash at lower tax rates’ and other tools) to invest in domestic research & development and to create jobs...and create a stable environment in which to operate. KP Note: 1) See John Chambers and Safra Catz, “The Overseas Profits Elephant in the Room,” The Wall Street Journal, 10/20/10. www.kpcb.com ne. at Might a Turnaround Expert Consider? B kpeb USA Inc. | What Might a T dE Consider? 372 HOUSE_OVERSIGHT_021027
Page 205 - HOUSE_OVERSIGHT_021028
Drive Growth: Infrastructure Better Infrastructure Reduces Transportation Costs For Input and Output Materials KP www.kpcb.com USA Inc. | What Might a Turnaround Expert Consider? 373 Public Investment in Infrastructure Has Helped Drive GDP Growth USA Real GDP and Public Investment in Infrastructure Average Y/Y Growth, 1950 -2007 Sat meme 1950-19790 +08 4.0% 4% ---- MMM -- ~~~ - poanunugay - - = = = == == == 2 1980 - 2007 3% ----\------- BB -------------- = I Real GDP & Public Investment in Infrastructure Average Y/Y Growth Rates (%) 0% Y/Y Growth in Y/Y Growth in : Y/Y Growth in YNY Growth in GDP Public GDP Public Investment in Investment in Infrastructure Infrastructure Source: Political Economy Research Institute, “How Infrastructure Investments Support the U.S. Economy: KP Employment, Productivity and Growth’, 1/09. (@E) www.kpcb.com USA Inc. | What Might a Turnaround Expert Consider? 374 HOUSE_OVERSIGHT_021028
Page 206 - HOUSE_OVERSIGHT_021029
But USA Inc.’s Investment in Infrastructure Has Been Steadily Declining for Five Decades... USA Inc. (Federal) Investment in Infrastructure as % of GDP, 1950 -2008 1.5% =~ += 22 eee eee en eee a a @ Ge ° = n @ 2 Bo 10% --f-- 4-22 eee en ne ne ee ne ne ee o = s 2) £ E £ = ow EB 0.5% -------------------- 9) ------------ + --22 22222222 ee oe eee eee n” o > E n e £ 4 2) a] 0.0% . T T T T T T T T T T T 1950 1955 1960 1965 1970 1975 1980 1985 1990 1995 2000 2005 KP Source: BEA. (@)E) www.kpcb.com USA Inc. | What Might a Turnaround Expert Consider? 375 ... Leading to Deteriorating Infrastructure in America and Pent-Up Demand for Investment American Society of Civil Engineers’ Report Card Grades for America’s Infrastructure, 1988 vs. 2009 1988 2009 Aviation B- D Bridges -- Cc Dams -- D Drinking Water B- D- Energy -- D+ Hazardous Waste D D Inland Waterways B D- Levees -- D- Rail -- C- Roads C+ D- School Buildings D D Solid Waste C- C+ Transit C- D Wastewater Cc D- Overall USA Infrastructure G.P.A. Cc D Cost to Improve -- $2.2T Note: The first infrastructure grades were given by the National Council on Public Works Improvements in its report “Fragile Foundations: A Report on omit Public Works, released in February 1988.” Source: American Society of Civil era eat free mag oe qo pee iGeS Per OB REeEy ans HOUSE_OVERSIGHT_021029
Sponsored
Page 207 - HOUSE_OVERSIGHT_021030
Drive Growth: Education Better Education Improves General Labor Quality and Enables Specialization For More Efficiency KP www.kpcb.com USA Inc. | What Might a Turnaround Expert Consider? 377 Education = High Long-Term ROI* Investment Each $1 of Government Spending Could Generate Up to $3 of Incremental Tax Return USA Inc. Net Present Value (NPV) for an Individual** Obtaining Secondary / Higher Education, 2005 NPV = $100,119 wy 81M0,000 ROI=299% £ & $120,000 -------------------------------------| 0 - - ----- = Unemployment Effect 2 o) w § $100,000 ------------------------------------- Em ~~ > ~~ > 5 2 3% 23 $0000 ------- NPV =$32,257 -—=s—as—s“( sid 1 Social Insurance Tax zs , L Revenues £u ROI = 109% ec. @ 2 $60,000 $<, (|)! —— £2 ox = Income Tax Revenues 25 $4000 es = %-___ > 2 _ S52 $2000 (i |} 3 8 = Public Foregone Tax a5 $0 Revenues @ a o = $20,000 [i --------- —_ = = Public Direct Cost a BADGE) m2 mex - me me ws en = in in eT me om ne a = Secondary Education Higher Education Note: * ROI (return on investment) caiculated as NPV of future incremental tax revenues divided by cost for government to support an individual for education. **Limited to male samples, female samples tend to have a KP lower public NPV. Source: OECD. (@E) www.kpcb.com USA Inc. | What Might a Turnaround Expert Consider? 378 HOUSE_OVERSIGHT_021030
Page 208 - HOUSE_OVERSIGHT_021031
While Government Spending on Education Increased 60% Over Past 50 Years, At Margin, Government Spent More on Healthcare... USA Total Government Healthcare vs. Education Spending as % of GDP, 1960 — 2008 Spending as % of GDP ——Total Government (Federal + State + Local) Spending on Health Care —— Total Government (Federal + State + Local) Spending on Education 0 % rPTrtTtfrr)rerrsrtTheTT TTT TT TT TT oT oT oT oT OT TOT OTT OT TT PFO POT TOT TOT TT TT TT TT TT TT TT TTT TT (1 1960 1964 1968 1972 1976 1980 1984 1988 1992 1996 2000 2004 2008 Note: Total government spending on healthcare includes Medicare, Medicaid and other programs and total government spending on education includes spending on pre-primary through tertiary education programs. Source: Dept. of Education, Dept. of Health & Human Services. (@)E) www.kpcb.com USA Inc. | What Might a Turnaround Expert Consider? 379 Despite Increased Government Spending, USA Education is Falling Behind — Math / Science Tests Scores Well Below OECD Average & Getting Worse Though Self Confidence Rising USA Ranking Out of 30-34* OECD Countries in PISA (Program for International Student Assessment for 15-Year Olds) 2000 / 2003 / 2006 / 2009 2000 2003 2006 aug 2008 Trend Mathematics 18 23 25 | | Science 14 19 21 | Reading 16 15 --** T Self Confidence’ - " 7 t Note: *30 OECD countries participated in 2000 / 2003 PISA, 34 OECD countries participated in 2006 / 2009 PISA. 1) Confidence is the self-perceived efficacy in learning abilities (for year 2000); mathematical problem solving abilities (for year 2003) and scientific problem solving abilities (for year 2006). USA tied in confidence ranking with Canada, Hungary, Slovakia, Switzerland and Liechtenstein in 2003 and tied with Poland and Canada in 2006. **2006 reading scores for KP USA were rendered invalid because of a printing error in questionnaire instructions. Source: OECD. www.kpcb.com USA Inc. | What Might a Turnaround Expert Consider? 380 HOUSE_OVERSIGHT_021031
Page 209 - HOUSE_OVERSIGHT_021032
USA Student Achievement Rankings* in Mathematics / Science Have Fallen vs. Other OECD Countries Mathematics Ranking* Science Ranking* 2000 2009 2000 2009 i Japan S. Korea 1 Korea Finland 2 S. Korea Finland 2 Japan Japan 3 New Zealand Switzerland 3 Finland S. Korea 4 Finland Japan 4 UK New Zealand 5 Australia Canada 5 Canada Canada 6 Canada Netherlands 6 New Zealand Estonia 7 Switzerland New Zealand 7 Australia Australia 8 ; Belgium 8 Austria Netherlands 9 Belgium Australia 9 Ireland Germany 10 France Germany 10 Sweden Switzerland 11 Austria Estonia 1 Czech Republic UK 12 Denmark Iceland 12 France Slovenia 13 Iceland Denmark 13 Norway Poland 14 Sweden Slovenia 14 USA ireland 15 Ireland Norway 45 Hungary Belgium 16 Norway . France 16 Iceland Hungary 17 Czech Republic Slovakia | 18 USA Austri 17 Belgium USA USila 18 Switzerland Czech Republic 19 Germany Poland 419 Spain Norway 20 Hungary Sweden ; 20 Germany Denmark 21 Spain Czech Republic 24 Poland France 22 Poland UK 22 Denmark Iceland 23 Italy Hungary 23 Italy Sweden 24 Portugal Luxembourg 24 Greece Austria 25 Greece USA 25 Portugal Portugal 26 Luxembourg Ireland 26 Luxembourg Slovak Republic 27 Mexico Portugal 27 Mexico Italy 28 Spain 28 Spain 29 Italy 29 Luxembourg 30 Greece 30 Greece 34 Israel 31 Israel 32 Turkey 32 Turkey 33 Chile 33 Chile 34 Mexico 34 Mexico KP Note: *USA ranking out of OECD countries in PISA (Program for international Student Assessment for 15-Year Olds). Source: OECD. (@)E) www.kpcb.com USA Inc. | What Might a Turnaround Expert Consider? 381 USA Young Adults’ (25-34) Higher-Education* Penetration Significantly Lags Behind Canada / Korea / Russia / Japan Percentage of 25- to 34-Year-Olds with an Associate Degree or Higher Among OECD Countries, 2007 Degree or Higher, 2007 Percentage of 25- to 34-Year-Olds with an Associate Israel Norway Fear Cem Iceland OECD Average ae NO wo oO oO oO oO PS PS PS PS Brazil |smms Turkey |aussa Czech Republic i | aly | ! ! Germany |x Polar _ | Estonia w#Hi$=iiic_ aa: Switzeran’d Netherlands {Et UK |i Sp) ee 1cjiur7 Portugal Hungary Greece Slovenia Finland Sweden Denmark Australia Ireland New Zealand Canada Luxembourg Note: (@E) www.kpcb.com *Higher education defined as post-secondary (college / university) education. Source: OECD. USA Inc. | What Might a Turnaround Expert Consider? 382 HOUSE_OVERSIGHT_021032
Sponsored
Page 210 - HOUSE_OVERSIGHT_021033
Focus on Revenues Drive Sustainable 1 = 1 Economic Increase / Improve Employment Growth KP www.kpcb.com USA Inc. | What Might a Turnaround Expert Consider? 383 Employment = Key to Growth in Federal Revenue & Expenses The deficit problem is exacerbated by the business cycle. A stagnant or declining job market means lower income (via tax revenue) and higher outlays (via entitlement expenses) for USA Inc. Tax Entitlement Revenue Expenses an Ke kpeb.com USA Inc. | What Might a Turnaround Expert Consider? 384 Unemployment HOUSE_OVERSIGHT_021033
Page 211 - HOUSE_OVERSIGHT_021034
Though Entitlements Are Structural, Not a Cyclical Problem, Entitlement Outlays Go Up with High Unemployment Real Entitlement Spending Y/Y Growth & Unemployment Rates, 1962 - 2009 Bp EET me = mm mem me = me mm mt = i = = 6 —— Real Entitlement Spending Y/Y wo “ —— Unemployment Rate = BY wes - eee ces ce eo ome cof oss cegI ceo posts mec com mest — mum tes GS REM! — mR RS Gem BT mR ee ae hale E ~ ~ 2 x S 1g ~~ - @ \ > 1 8 ! = 8% oN ’ D 4 £ ? = £ 0% . T T T T T T T T Fe T T T 1 ” 5 £ 86% Correlation Between 1986 & 2009 a < Lu rs] wo GIG wm — me me = me ce = kt 1962 1966 1970 1974 1978 1982 1986 1990 1994 1998 2002 2006 Note: Real spending adjusted for inflation. Fiscal year ends in September. Source: White House Office of Management & K P Budget, Bureau of Labor Statistics. www.kpcb.com USA Inc. | What Might a Turnaround Expert Consider? 385 Increase Employment — High-Level Policy Options to Consider Short-run options: 1) Payroll tax holiday and/or 2) Employment tax credit and/or 3) Job training and/or ) 4) Restore labor mobility by reducing housing imbalances Medium- to long-run options: 1) Reduce employer health care costs and/or 2) Improve vocational training/education and/or 3) Encourage inward foreign direct investment, “onshoring” which would increase domestic employment KP Source: Richard Berner, “Employment Prospects and Policies to Improve Them’ (2/26/10), Morgan Stanley Research. (@E) www.kpcb.com USA Inc. | What Might a Turnaround Expert Consider? 386 HOUSE_OVERSIGHT_021034
Page 212 - HOUSE_OVERSIGHT_021035
Increase Employment: Structural Problems in USA Labor Force High Healthcare Costs + Skills Mismatch + Labor Immobility e Healthcare costs may be a barrier to hiring for employers — Healthcare benefits = 8% of average total employee compensation; grew at 6.9% CAGR from 1998 to 2008 compared with 4.5% CAGR in salaries. — Healthcare benefits are fixed costs as they are paid on an annual per-worker basis and do not vary with hours worked. — As employers try to lower fixed costs to right-size to reduced revenue levels, layoffs are the only way to reduce fixed healthcare costs. e Skills mismatch may be a barrier to hiring for employers — Alarge portion of the long-term unemployed may lack requisite skills. — 14% of firms reported difficulty filling positions due to the lack of suitable talent, per 5/10 Manpower Research survey. e Labor immobility resulting from the housing bust may be a barrier to hiring — One in four homeowners are “trapped” because they owe more than their houses are worth, so they cannot move to take new jobs — until they sell or walk away. KP Source: Richard Berner, “Why is US Employment So Weak” (7/23/10), Morgan Stanley Research. www.kpcb.com ne. at Might a Turnaround Expert Consider? B kpeb USA Inc. | What Might a T dE Consider? 387 Increase Employment: Immigration Does Not Take Away Jobs in USA; It Improves Productivity + Boosts Income per Worker e Immigration = Positive Impact on USA Productivity & Income per Worker e Immigration = Neutral Impact on Employment for U.S.-Born Workers % Change in USA Productivity / Income per Worker / Employment for U.S.-Based Workers In Response to an Inflow of Immigrants Equal to 1% of Employment —— Productivity —— Income per Worker —— Employment for U.S.-Born Workers Immigration's Impact as % of Employment / Income / Productivity Increase Years After Immigration Source: Giovanni Peri, “The Effect of Immigrants on U.S. Employment and Productivity,” 8/30/2010 Federal Reserve Board of San Francisco (FRBSF) Economic Letter 2010-26. (@E) www.kpcb.com USA Inc. | What Might a Turnaround Expert Consider? 388 HOUSE_OVERSIGHT_021035
Sponsored
Page 213 - HOUSE_OVERSIGHT_021036
2 Focus on Revenues Drive Sustainable Economic Growth a bs www.kpcb.com USA Inc. | What Might a Turnaround Expert Consider? 389 Improve Competitiveness Without appropriate government incentives in Education / Technology / Infrastructure / Employment, USA Inc. may continue to lose relative competitive strength to other countries. Kp www.kpcb.com USA Inc. | What Might a Turnaround Expert Consider? 390 HOUSE_OVERSIGHT_021036
Page 214 - HOUSE_OVERSIGHT_021037
Compared to 10 Years Ago, USA is Losing Competitiveness at the Margin vs. lts Peers e McKinsey conducted a study in 2010 that compares the USA with other countries on 20 attributes related to economic fundamentals, business climate, human capital and infrastructure. McKinsey compared current status vs. status in 2000. e We augmented the McKinsey study with 9 additional attributes across those aforementioned areas as well as government spending metrics. e Through this study, we found that America, relative to other countries, improved on none of the 29 attributes, remained the same on 9 attributes (including GDP per capita, public debt as % of GDP, public spending on healthcare, public spending on education, growth in local innovation clusters, population & demographic profile, retention of foreign-born talents, total healthcare spending and cost-adjusted labor productivity) and deteriorated on 20 (including trade surplus, national spending on R&D, industrial production, corporate tax rate, business environment, FDI, tax incentives for R&D, number of patent applications, availability of high-quality labor, higher education penetration, telecom & transportation infrastructure, etc.). KP www.kpcb.com USA Inc. | What Might a Turnaround Expert Consider? 391 USA Ranking High in Country Attractiveness Indicators But Losing Share at the Margin... US Relative Position Key metrics Ten Years Ago Today Trend Economic Household consumption B B Vv Fundamentals Household consumption growth | iss Vv GDP | | Vv GDP per capita? Oo GB = Stock market capitalization oO Oo Vv Technology company market cap? oO | Vv Industrial production B | Vv Trade as % of GDP o iia v Trade surplus2 oO Oo Vv National spending on R&D | i Vv Defense spending? oO | v Spending Government public debt as % GDP2 | | a Public healthcare spending as % of GDP2 Oo | = Government surplus as % of GDP? Oo ol Public expenditure on education B B = @@ Top Ranked @ Top Quartile ™ Average Hi Bottom Quartile Source: 1) Growth and competitiveness in the United States: The role of its multinational companies, seme cor MennseY COSA Ine. [What Might a Tumeround Expert Consider? 302 HOUSE_OVERSIGHT_021037
Page 215 - HOUSE_OVERSIGHT_021038
... USA Ranking High in Country Attractiveness Indicators But Losing Share at the Margin US relative position Key metrics Ten Years Ago Today Trend Statutory corporate tax rate in | v Business climate Business environment | oO v FDI as % of GDP | v Growth of local innovation clusters o | — Tax incentives for R&D o | v Population and demographic profile a im — Human capital Availability of high-quality labor | | Vv Retention of foreign-born talent i | — Cost-adjusted labor productivity A Ba — Total healthcare spending per Capita? | | —= Higher education penetration2 im oO Vv Number of patent applications | | Vv Transportation | o Vv Infrastructure Telecommunications o oO v ™@ Top Ranked @ Top Quartile ™ Average Hi Bottom Quartile : Source: 1) Growth and competitiveness in the United States: The role of its multinational companies, KP McKinsey & Company. 2) estimates based on data from IMF / OECD (@)E) www.kpcb.com USA Inc. | What Might a Turnaround Expert Consider? 393 USA's Share of Global GDP Has Declined from 33% in 1985 to 24% in 2010, While China / Brazil / Korea’s Shares Have Risen Share of World GDP, USA vs. China / Brazil / India, 1985 — 2010E 100% 80% = a 8 60% 3S = ° = ge Ps 40% @ = ” 1985-2010E Share Loss = -9% 0% 1985 1987 1989 1991 1993 1995 1997 1999 2001 2003 2005 2007 2009 KP Note: Data are NOT adjusted for purchasing power parity. Source: IMF. www.kpcb.com USA Inc. | What Might a Turnaround Expert Consider? 394 HOUSE_OVERSIGHT_021038
Sponsored
Page 216 - HOUSE_OVERSIGHT_021039
Focus on Revenues Invest in Technology / Infrastructure / Education Drive Sustainable Economic Increase / Improve Employment Growth = Improve Competitiveness Consider Review Tax Rates Changing oe Reduce Subsidies / Tax Expenditures*/ eee Broaden Tax Base KP www.kpcb.com USA Inc. | What Might a Turnaround Expert Consider? 395 Simple Tax Math* — Big Across-the-Board Tax Rate Increases Would Be Needed to Potentially Generate Meaningful Revenue Improvements Each one percentage point across-the-board tax rate increase would generate an incremental $127 billion revenue for USA Inc. in F2010E"...excluding any related negative impact on spending / GDP growth, which is difficult to do... ...Which Would Reduce Across-the-Board Hypothetical Revenue Increase for Fetimatad Lesees in Tax Rate Increase USA Inc. in F2010E ($ billions) F2010E by 1 Percentage Point $127 8% 2 Pereeniage $254 16% Points (pps) 3 pps $381 24% 4 pps $508 33% 5 pps $635 41% 10 pps $1,270 82% Note: *The simple tax math presented here are pure mathematical illustrations — we simply calculated how big a broad-based tax rate increase (for individual and corporate income, as well as payroll) would have to be for USA inc. to financial break-even. These calculations are merely mechanical illustrations and are not meant to portray realistic solutions. 1) Incremental dollar amount calculated as 1% of projected total personal & corporate KP income, which historically has been at ~87% of GDP. Source: F2010E revenue & deficit per White House OMB, GDP per CBO. (@E) www.kpcb.com USA Inc. | What Might a Turnaround Expert Consider? 396 HOUSE_OVERSIGHT_021039
Page 217 - HOUSE_OVERSIGHT_021040
More Complex Tax Math: If Lower Brackets Excluded, Draconian Rate Hikes Required to Attempt to Bring USA Inc. Budget Into Financial Balance Current Federal Income Tax Rates vs. Rates Needed to Reduce Deficit to 3% of GDP in 10 Years 100% @ ee 80% --- ee 7T7T%_- = u Current Federal Income Tax Rates ”n £ O Marginal Tax Rates Required to Balance USA Inc.'s Budget* 60% oO e wo £ 8 Ca = ° 33% £ 28% 28% oS 25% 25% i 20% i i a 10% 10% Tier 1 Tier 2 Tier 3 Tier 4 Note: *The tax math presented here are pure mathematical illustrations — it is simply calculated to measure how much tax rates need to increase (for the top two income brackets) to achieve a deficit-to-GDP ratio of 3% by 2019E assuming a baseline budget path and relying on personal income tax rate hikes alone. These calculations are merely mechanical illustrations and are not meant to portray realistic solutions. ource: The Urban Institute (Desperately Seeking Revenue, By Altshuler, Lim and Williams, Si The Urban Institute (D tely Seeking R By Altshuler, Li ct Willi 1/5/2010. www.kpcb.com ne. at Might a Turnaround Expert Consider? B kpeb USA Inc. | What Might a T dE Consider? 397 Pros + Cons of Tax Rate Hikes e Amore progressive income tax system could lower tax burden from potential subsidy cuts and carbon taxes on the low-income population. e Addressing income inequality may enhance perceived fairness — and political chances — of comprehensive deficit measures. Across-the-board tax rate increases would hurt nearly everyone, but especially lower-income taxpayers. Rate increases on upper brackets usually spur tax avoidance, and revenues often fall short of targets. Rate increases, which discourage savings, amplify distortions in the economy from tax subsidies, exclusions and tax expenditures, all of which encourage consumption. KP www.kpcb.com USA Inc. | What Might a Turnaround Expert Consider? 398 HOUSE_OVERSIGHT_021040
Page 218 - HOUSE_OVERSIGHT_021041
Despite Multitudes of Tax Rate Changes, USA Inc.’s Tax Revenue as Percent of GDP Remained Roughly Stable at 15-20% from 1960-2002 Federal Tax Receipts by Category as % of GDP, 1960 - 2009 = Individual Income Corporate Income _& Social Insurance Excise & Other 50- | Trendline Ngan 10% Federal Tax Receipts as % of GDP 0% 1960 1965 1970 1975 1980 1985 1990 1995 2000 2005 KP Source: White House OMB (@)E) www.kpcb.com USA Inc. | What Might a Turnaround Expert Consider? 399 Focus on Revenues Consider pangs Mer Reduce Subsidies / Tax Expenditures*/ ENaC Broaden Tax Base KP www.kpcb.com USA Inc. | What Might a Turnaround Expert Consider? 400 HOUSE_OVERSIGHT_021041
Sponsored
Page 219 - HOUSE_OVERSIGHT_021042
Illustrating the Revenue Tradeoffs — Changing Tax Rates vs. Broadening the Tax Base Mathematical Illustrations* 1) To eliminate F2010 deficits by increasing individual / corporate / payroll tax rates across-the-board would require +12 percentage points of tax rate increase (raising $1.4 trillion) — and would likely damage economic growth? or 2) To eliminate primary budget deficit** by F2019E by increasing top two tiers of income tax rates would require moving marginal rates to 72% / 77% from 33% / 35% — also likely to damage growth and encourage tax avoidance? or 3) Broadening tax base could require reducing ‘tax expenditures’ and subsidies, e.g., limiting deductions and subsidies for housing & healthcare? Policy Options 1) Acombination of somewhat higher rates and a broader tax base? and/or 2) Changing taxation of individual income to encourage saving / investment rather than consumption (perhaps a value-added tax and/or carbon tax)? and/or 3) Changing taxation of corporate income to reflect global competition? Note: *The simple tax math presented here are pure mathematical illustrations — we simply calculated how big a broad-based tax rate increase (for individual and corporate income, as well as payroll) would have to be for USA Inc. to financial break-even. These calculations are merely mechanical iflustrations and are not meant to portray realistic solutions. **Primary budget deficit is the budget deficit excluding net interest payments. www.kpcb.com USA Inc. | What Might a Turnaround Expert Consider? 401 Changing USA Inc.’s Tax System Could Help Rebalance the Economy & Reallocate Resources e Though there would be adjustment costs, reducing subsidies and ‘tax expenditures’ could broaden the tax base and collect more revenue, while allowing income tax rates to stay low or go lower. e The current system favors consumption, penalizes saving; a tax based on consumption (or “value added”) could offset some of that penalty, though there are risks and drawbacks. e Subsidies create incentives to consume more health insurance and housing — both account for 20% of GDP, vs. 11% in 19651 — and take resources from other sectors like education, technology, infrastructure. e A worldwide corporate tax system with a lower tax rate could reduce incentives for companies to keep income offshore. e Acarbon tax could raise some additional revenue to reduce the deficit, while encouraging sustainable economic development. KP Source: 1) per BEA and CMS. (@E) www.kpcb.com USA Inc. | What Might a Turnaround Expert Consider? 402 HOUSE_OVERSIGHT_021042
Page 220 - HOUSE_OVERSIGHT_021043
Changing Tax Policy to Broaden Tax Base: Subsidies + Tax Expenditures = 70% of USA Inc.’s Cash Flow Deficit USA Inc.’s Deficit vs. Aggregate Subsidies and Tax Expenditures*, F2009 1,600 —— & 1,400 5 = Some tax expenditures favor V7 consumption... Qo 1,200 ied Such as tax exemption on 5 4.000 employer contributions to health = , insurance & deductibility of 7 mortgage interest on owner- = 800 occupied homes... i} * & 0 600 1 ...But others favor saving, Sg investment, and growth 3 g 400 3 Such as tax exemptions / a deductibility on capital gains / 3 200 dividends / pension contributions u & savings / accelerated ' depreciation of equipment... F2009 Deficit F2009 Subsidies & Tax Expenditures Note: *Each foregone revenue estimate assumes ail other parts of the Tax Code remain unchanged during F2009. Aggregate tax subsidies presented here is simply the sum of individual estimates. In reality, the aggregate estimate would be different if tax subsidies were changed simultaneously because of potential interactions among provisions. KP Source: White House OMB, “Analytical Perspective — Budget of the U.S. Government, Fiscal Year 2011.” (@)E) www.kpcb.com USA Inc. | What Might a Turnaround Expert Consider? 403 Raising Revenue by Reducing Tax Expenditures & Subsidies: Examples * Reducing the biggest tax expenditures and subsidies could net $1.7 trillion in additional revenue over the next decade, per CBO and the Committee for a Responsible Federal Budget: — Reduce the tax exclusion for health insurance or replace with a credit — Cap the deduction for state and local taxes Gradually reduce the mortgage interest deduction or change to a credit Limit the tax benefit of other deductions, e.g., charitable contributions ¢« Some subsidies encourage saving or investment...and cutting them could mean short-term revenue gain but a net loss over time. Examples: — Favorable taxation of capital gains, dividends, and pension contributions — Exclude investment income from life insurance and annuities in taxable income — Accelerated depreciation or expensing of capital equipment outlays Source: Sources: Congressional Budget Office, Budget Options Volume 1: Health Care and Volume 2, 2009; Committee for a KP Responsible Federal Budget, Let’s Get Specific: Tax Expenditures (October 2010) (@E) www.kpcb.com USA Inc. | What Might a Turnaround Expert Consider? 404 HOUSE_OVERSIGHT_021043
Page 221 - HOUSE_OVERSIGHT_021044
USA’s Unbalanced Economy — Personal Consumption (Driven in Part by Healthcare) = 71% of GDP vs. 62% From 1950 To 1980... Personal Consumption as % of GDP, 1950 - 2009 Personal Consumption as % of GDP — -=Personal Consumption (ex. Healthcare) as % of GDP Personal Consumption as % of GDP - “\aly Vv BBY od) 1950 1955 1960 1965 1970 1975 1980 1985 1990 1995 2000 2005 Note: Personal consumption includes household consumption of ail goods and services. Source: BEA, Federal Reserve. www.kpcb.com USA Inc. | What Might a Turnaround Expert Consider? 405 ... USA’s Unbalanced Economy — National Savings (Personal + Corporate + Government Savings) = -3% of GDP, vs. 10% From 1950 To 1980 USA Net Saving as % of GDP, 1950 - 2009 0% + USA Net National Saving as % of GDP 1950 1955 1960 1965 1970 1975 1980 1985 1990 1995 2000 2005 Note: National savings equal the aggregate savings by household, corporate and government sectors. KP Source: BEA, Federal Reserve. (@E) www.kpcb.com USA Inc. | What Might a Turnaround Expert Consider? 406 HOUSE_OVERSIGHT_021044
Sponsored
Page 222 - HOUSE_OVERSIGHT_021045
Current Tax Policies Help Spur Consumption — USA’s Taxes on Consumption of Goods & Services Lowest Among Peers Taxes on Consumption of Goods & Services as % of GDP Among OECD Countries, 2007 BOT qemgqns oo oo ens cee ee em en ae TE ET ED DE S i=] N o Se ; = ° = BUI Jem oem me mr mer = cee er mi eee re me en em mo Se Se Se Se = em SBE < 2 a] fos E 8% |-|-----@- SRO RRR Be eh eee eee eee eee eee 7) < ° oO 5 4 SEE aaa ” a * (] - (J Pas = Ml 1 ese 1 Ce el ee rae Se Tl T eee eet ol) ee Me eee 0% oS SSB OfFLDKY >A HOY EDOTATYH DAH BATS te P¥X TB —- wv = = oD = = vw Oo = Fee Sess sr 7 & &s sage saezas S Sue PSS SS8LlSHS ESGRP BZBeoFaZsts5SeceegoetPEsu oa 2X 2% 4 £ ES o@ 22fitgea 6 o£ 8 ce $ N° Z E 8 <a o-oo Qar fzigrgosGge 2 < o (o) 4 s a“ ara E x a c o 2 x 77) 3 Oo o 22s = Ww o => ro) a ie) ” KP Source: OECD, 2009 database. i USA Inc. | What Might a Turnaround Expert Consider? 407 America’s Resources Allocated to Housing + Healthcare Nearly Doubled as a Percent of GDP Since 1965, While Household and Government Savings Fell Dramatically Healthcare + Housing Spending vs. Net Household + Government Savings as % of GDP, 1965-2009 EG. mo ns a = em ae as = a SO an RR = Sak a = a Dw a a ——Housing + Healthcare Spending as % of GDP 20% Re rere Sie = ee Ee eee ee — ee dM @ eo oe = a —o— Net Household + Government Savings as % of GDP VBYo ce . 611% R10, ee a a ee gm 8S Ss = m8 a a -_ ° = yg we a oe ag Rg we ce on 9 ot oar me mec me << 0% . T T T T T T T T T T T T T T T T T T T T 1 1965 1970 1975 1980 1985 1990 1995 2000 2005 Bf: wt tees ce ate ee Me es Ce MRE FORE 9 Te ES eS RS Un es eH = ne ei Hae Nee tele -9% MAUI mee me se 9m ma mm = i ea SE SE A BT TE BD TE HT a TE - S Note: Housing includes purchase, rent and home improvement. Government savings occur when government runs a surplus. KP Source: BEA, CMS via Haver Analytics. (@E) www.kpcb.com USA Inc. | What Might a Turnaround Expert Consider? 408 HOUSE_OVERSIGHT_021045
Page 223 - HOUSE_OVERSIGHT_021046
USA Income Taxes Higher, Consumption Taxes Lower Than OECD Peers Government Tax Revenue as % of GDP, USA vs. OECD Average, 2007 Variance Tax Type USA OECD Average (USA — OECD) Individual Income Taxes 10.8% 9.4% 1.4% Property Taxes 3.1 1.9 1.2 Other Ay 5.0 Corporate Income Taxes 3.1 oo Social Security Taxes Value Added Taxes Total KP Source: OECD Tax Database. (@)E) www.kpcb.com USA Inc. | What Might a Turnaround Expert Consider? 409 Tax Policy Options From Report of the National Commission on Fiscal Responsibility and Reform e Consolidate the tax code into three individual income rates (15% / 25% / 35%) and one corporate income rate (26%) e Eliminate the complex tax codes such as AMT', PEP2, and Pease? e Triple standard deduction to $30,000 ($15,000 for individuals) e Repeal state & local tax deduction and miscellaneous itemized deductions e Limit mortgage deduction to exclude 2™ residences, home equity loans, and mortgages over $500,000 e Limit charitable deduction with floor at 2% of Adjusted Gross Income e Cap income tax exclusion for employer-provided healthcare at the amount of the actuarial value of Federal Employees Health Benefits Plan (FEHBP) standard option e Permanently extend the research tax credit for businesses e Eliminate and modify several business tax expenditures (domestic production deduction / LIFO* method of accounting / energy tax preferences for the oil and gas industry / depreciation rules) e International tax reform including a territorial system@ Note: 1) AMT is the Alternative Minimum Tax; 2) PEP is Personal Exemption Phase-out designed to eliminate personal income exemptions for high earners; 3) Pease is a similar phase-out, but instead of applying to personal exemption, it applies to most of the itemized deductions of a taxpayer's claims (mortgage interest, charitable gifts, state & local taxes paid, etc.); Pease is named after Representative Donald Pease (D-OH) who pushed for its enactment in 1990. 4) LIFO is Last In, First Out’ which tend to reduce corporations’ income taxes in times of inflation. 5) A territorial tax system is a tax system that taxes only income that is created within the borders of a specific territory (usually a country). Source: National Commission on Fiscal Responsibility and Reform, “The Moment of Truth: Report of the National Commission on Fiscal Responsibility and Reform,” 12/1/10. Note that the Report also identified two other scenarios called the ‘The Zero Plan’ which eliminates all tax expenditures and ‘Tax Reform Trigger’ which forces Congress to undertake comprehensive tax reform K P by 2012 by raising taxes for each year Congress fails to act. | (@E) www.kpcb.com USA Inc. | What Might a Turnaround Expert Consider? 410 HOUSE_OVERSIGHT_021046
Page 224 - HOUSE_OVERSIGHT_021047
A412 HOUSE_OVERSIGHT_021047
Sponsored
Page 225 - HOUSE_OVERSIGHT_021048
Consequences of Inaction KP www.kpcb.com USA Inc. | Consequences of Inaction 413 To Take a Step Back... e We Asked the Question — How would public shareholders view USA Inc.? e What Have We Found? — USA Inc.’s finances — short-term and long-term, income statement and balance sheet — are challenged. Management’s policies have created incentives to invest in healthcare, housing, and current consumption rather than in productive capital, education, and technology — the tools needed to compete in the global marketplace. KP www.kpcb.com USA Inc. | Consequences of Inaction 414 HOUSE_OVERSIGHT_021048
Page 226 - HOUSE_OVERSIGHT_021049
Consequences of Inaction — Investor Perspective e Short Term, No Problem Yet Global bond investors, in part, have looked past USA Inc.’s deteriorating financials because growth, inflation, and Fed purchases matter more, and because income statements and balance sheets of many other developed countries (Such as Greece / Spain / Portugal / Ireland) are worse. e Long Term, Consequences of Inaction Could Be Severe If USA Inc.’s “managers” and “board” continue to ignore rising unfunded entitlement spending, investors could eventually demand a higher return to lend money to USA Inc. — leading to rising bond yields / higher borrowing costs for USA Inc. At some point, USA Inc.’s currency could also weaken significantly. Source: Richard Berner, “America’s Fiscal Train Wreck” (7/2/2009), Morgan Stanley Research. KP www.kpcb.com USA Inc. | Consequences of Inaction 415 For Perspective, USA Inc.'s 55% Public Debt as % of GDP (2009) is in Middle of Pack When Compared with ‘Top 25’ Global Peers, Though Rising to 90% ‘Warning’ Level* Rank Country As % of Net Debt as % of GDP As%of 2009 Budget As % of 2009 2009 Net Debt World 05-09 | 2009 GDP World Surplus/ World Gross Unemploy- Y/Y Outstanding ($B) Y/Y Total 2009 2005 Change ($B) YIY Total Deficit ($B) Deficit ment Rate (pps) = ON Onahwonhd Japan Italy Greece Belgium France Germany Austria Netherlands Argentina USA Poland Spain Norway Sweden Brazil Switzerland Denmark Turkey Australia Venezuela China Russia ° xs NoaogoeenNnagaoeen @obsatdtdrtobkhnbndbaohkhdboaohkhadnonagd NOoO ANA aA aA wWaAaBaNAGAANANA OG AA 1 1 6 7 1 2 4 3 1 1 3 1 2 1 1 2 1 0 1 1 0 2 0 Top 1-25 Global $32,438 $47,081 -3% 81% $2,790 34,632 57,937 -2 100 2,885 Note: “Carmen Reinhart and Kenneth Rogoff observed from 3,700 historical annual data points from 44 countries that the relationship between government debt and real GDP growth is weak for debt/GDP ratios below a threshold of 90 percent of GDP. Above 90 percent, median growth rates fall by one percent, and average growth falls considerably more. . We note that while Reinhart and Rogoff's observations are based on ‘gross debt’ data, in the U.S., debt held by the public is closer to the European countries’ definition of government gross debt. For more information, see Reinhart and Rogoff, “Growth in a Time of Debt,” 1/10. Pps is percentage points. Source: {MF, Business Intelligence Monitor . KP www.kpcb.com USA Inc. | Consequences of Inaction 416 HOUSE_OVERSIGHT_021049
Page 227 - HOUSE_OVERSIGHT_021050
On a Net Worth Basis, USA Inc. Also Sits in Middle of Pack vs. Western European Peer Governments Illustrative Estimates* of Government Net Worth, 2009 o. 400% ---------------.--.--..-___._..._._. . .- rs} Better Than USA Worse Than USA x) = 0% t T T T T T T T T T 1 G s S a Cost of Ageing = 400% -------- Ht fff = a Pa 5 Structural Deficit E 00% ------------------------- _g | _. 4 7 @ structural Deticl o > fo) 2 1200% | satnitial Debt Level 3s E n LU -1600% ~--------=-----.--.--..-___.._.._. _. . .- > > a = x ¥ c ze] 0) c = 5 S @ w > o @ Si = rs DB G =} i) 2. iy o = oO i 5 * £ a) G5 a a. Note: *Estimates of government net worth depends heavily on underlying assumptions such as projections for GDP, demographics, policy changes, etc. Net worth estimates may differ from U.S. Dept. of Treasury’s data (used in earlier slides). For more details on underlying assumptions, please refer to Morgan Stanley Research’s Global Outlook piece “Sovereign Subjects: Ask Not Whether Governments Will Default, But How,” 8/25/10. KP Source: Arnaud Mares, Morgan Stanley Research. www.kpcb.com USA Inc. | Consequences of Inaction 417 Combined With US Dollar's Reserve Currency Status, Investors Still Prefer USA Inc.’s Debt, For Now Global Aggregate Foreign Exchange Reserves by Currency, 1999 — 2010* (ams Other Currencies mas Euros $5,000 ---- MMMIUS Dollars re mes im tt es es im = em i gc eS ct -- ——US Dollars’ Share of Total 75% - 50% 25% Global Foreign Exchange Reserves (US$B) wn wn wn = N wo ‘eo ‘eo r=) oO Oo oO Oo oO oO US Dollars’ Share of Total 0% 1999 2000 2001 2002 2003 2004 2005 2006 2007 2008 2009 2010* KP Note: 2010 data are preliminary and as of CQ3. Source: IMF. www.kpcb.com USA Inc. | Consequences of Inaction 418 HOUSE_OVERSIGHT_021050
Sponsored
Page 228 - HOUSE_OVERSIGHT_021051
However, in Longer Term, Credit Rating Agencies Have Begun to Worry About USA Inc.’s Debt Affordability On balance, we believe that the ratings of all large Aaa governments [including USA Inc.] remain well positioned, although their ‘distance-to-downgrade’ has in all cases substantially diminished...Growth alone will not resolve an increasingly complicated debt equation...Preserving debt affordability at levels consistent with Aaa ratings will invariably require fiscal adjustments of a magnitude that, in some cases, will test social cohesion. ' - Pierre Cailleteau Managing Director of Sovereign Risk at Moody’s, 3/16/2010 .../f there are not offsetting measures to reverse the deterioration in negative fundamentals in the U.S., the likelihood of a negative outlook over the next two years will increase. 2 Sarah Carlson, Senior Analyst at Moody's, 1/14/2011 KP Sources: 1) Bloomberg, The New York Times; 2) The Wall Street Journal (@)E) www.kpcb.com USA Inc. | Consequences of Inaction 419 Treasury Swap Spread’ Turned Negative For First Time in History? — Now Cheaper for Some Private Companies to Borrow than USA Government 10-Year Treasury Swap Spreads & Federal Budget Deficit / Surplus, 1988 — 2010 160 4% 3 30 2% x _~ 2) & 120 = 2 0% % 3 5 $ 100 a g 2% a ” > a 80 BS $ 4% Za n on 60 ie =) a 6% Z g 40 a . 2% § = 20 3 - rg O|. “10% & > -20 -12% 1988 1990 1992 1994 1996 1998 2000 2002 2004 2006 2008 — 10y Treasury Swap Spreads (left axis) -==Federal Budget Deficit/Surplus as % of GDP (right axis) Note: 1) Treasury swap spread = Treasury yield — swap rate (between bonds of comparable maturity); swap rate is the fixed interest rate that the buyer demands in exchange for the uncertainty of paying the short-term LIBOR (floating) rate over time; swap rates are generally higher than Treasury yields with corresponding maturities as they include incremental credit risk associated with the banks that provide swaps compared to Treasuries, which are viewed as risk-free. 2)10-year Treasury swap spread turned negative on 3/24/10, while 30-year Treasury swap spread turned negative in 10/08 and shorter-term Treasury swap spreads are still positive. Source: Bloomberg. (@E) www.kpcb.com USA Inc. | Consequences of Inaction 420 HOUSE_OVERSIGHT_021051
Page 229 - HOUSE_OVERSIGHT_021052
Financial Challenges for Countries are Not Uncommon Of course, there are no exact precedents for the financial challenges faced by America and many other countries in the world today. Yet a quick overview of a few government and corporate financial crises may illustrate how managements have addressed — or failed to address — the problems of their day. (@)E) www.kpcb.com USA Inc. | Consequences of Inaction 421 History Doesn't Repeat Itself, But It Often Rhymes’ — What Can We Learn From These Credit Crises? Sovereign Credit Crisis 2010 — Greece ($374B Debt Outstanding — 113% of GDP) 2009 — Dubai ($26B — 32% of GDP) 2001 — Argentina ($132B — 130% of GDP) 1998 — Russia ($73B — 27% of GDP) State / Local Financial Woes 1975 — New York City ($14B* Debt Outstanding) Corporate Bankruptcy 2009 — General Motors ($95B Debt Outstanding) Note: 1) Attributed to Mark Twain. *NYC government and subsidiaries had $14B debt outstanding in 1975. Adjusting for inflation, $14B of 1975 dollars would have been ~$50B in today’s dollars. Source: sovereign data points per IMF and =) World Bank. NYC data point per California Research Bureau “Overview of New York City’s Fiscal Crisis,” 3/1/1995. (@E) www.kpcb.com USA Inc. | Consequences of Inaction 422 HOUSE_OVERSIGHT_021052
Page 230 - HOUSE_OVERSIGHT_021053
Simple Pattern Recognition From Historical Debt Crisis Reveal Common Drivers (Leverage & Entitlements) + Triggers Yearof Debt Restructured Long-Term Short-Term Key Crisis Amount % of GDP Drivers Triggers Stakeholders Rising Underfunded ; ; . International Bond Greece 2010 $374B 113% ; ; Financial Crisis Entitlement Spending Investors ; Leveraged Construction / ; ; . International Bond Dubai 2009 26B 32 Financial Crisis Real Estate Bubble Investors Rising Underfunded Argentina 2001 132B 130 Entitlement Spending + Financial Crisis International Bond Investors Currency Peg ; Declining Productivity + ; ; _. International Bond Russia 1998 73B 27 Financial Crisis Currency Peg Investors . Bond Investors + New York Rising Underfunded : ; 1975 14B! on ; ; Recession Federal City Entitlement Spending Government Note: 1) NYC government and subsidiaries had $14B debt outstanding in 1975. Adjusting for inflation, $14B of 1975 dollars would have been ~$50B in today’s dollars. Source: sovereign data points per IMF and World Bank. NYC data point per California Research Bureau “Overview of New York City’s Fiscal Crisis,” 3/1/1995. www.kpcb.com nc. | Consequences of Inaction B kpeb USA Ine. | C f | i 423 Lessons Learned: Historical Debt Crisis e Rising Unfunded Entitlement Spending = Often a Long-Term Driver of Debt Crisis — Countries such as Greece / Argentina and cities such as New York all nearly brought down by unfunded entitlement spending. e Financial Crisis / Economic Downturn = Often the Short-Term Trigger of Debt Crisis — All cases had similar short-term triggers. e External Forces = Often Key Stakeholders in Crisis & Driving Ensuing Changes — Most sovereign credit crises + ensuing reforms were driven by loss of confidence of international bond investors. — New York City’s near default was driven by demands from bond holders + refusal of bailout from federal government. KP www.kpcb.com USA Inc. | Consequences of Inaction 424 HOUSE_OVERSIGHT_021053
Sponsored
Page 231 - HOUSE_OVERSIGHT_021054
While High Government Debt Levels Could Hasten Economic Recovery Post Recession, There Are Many Long-Term Negative Consequences Crowding Out Investment =» Lower Output & Income ~ A growing portion of people’s savings would be diverted to purchase government debt rather than toward investment in productive capital goods. Higher Interest Payments = Higher Tax Rates & Lower Output & Income — Government may be forced to raise marginal tax rates and / or reduce spending on other programs to meet interest payments. e Reduced Ability to Borrow > Less Policy Flexibility — In case of economic downturns or international crises, government may not be able to raise substantially more debt. e Increased Chance of Sudden Fiscal Crisis Social / Economic Disruption — Investors may lose confidence in government’s ability to repay debt & interest without causing inflation. (@E www.kpcb.com Source: Congressional Budget Office, “Federal Debt and the Risk of a Fiscal Crisis.” 7/10. USA Inc. | Consequences of Inaction 425 Lessons Learned: For Countries Burdened by High Debt Levels, Austerity Measures are Necessary 208 Gross Debt Deficit as ° 2009-2010 Austerity Measures New Revenue Streams % of GDP as % of GDP Greece ti Ireland Spain Portugal (@ www.kpcb.com 14% 11% 11% 113% 66% 54% e Wage freeze & bonus cut of 14% on all public sector employees e Reduction in government contract workers e 11% reduction in pensions & Increase in retirement age to 65 from 58 e 5-15% pay cut & 4% benefit reduction for all public sector employees e $1.5B+ broad spending cuts in healthcare & infrastructure e Hiring freeze for public sectors e Increase of retirement age to 67 from 60 e Total budget cut of $70B 10-13E e Joint IMF—EU bailout of $146B e Tax increases for VAT (+2%) / fuel / alcohol / cigarette (+ 10%) e Clamp down on tax evasion e Carbon tax on fuel e 1% tax rise on personal income about 120K euros e Sold $7B in new bonds 9% 78% e Wage freeze on all public sector employees e Reduce state payroll via attrition e 50% bonus tax on top bank executives e Privatize state-owned industries Source: Eurostat, European Commission, IMF, New York Times, Financial Times, BBC, Wall Street Journal. USA Inc. | Consequences of Inaction 426 HOUSE_OVERSIGHT_021054
Page 232 - HOUSE_OVERSIGHT_021055
European Countries (including Greece, Portugal, Ireland and Spain) Have Committed A Rising Share of GDP to ‘Social Benefits’ Over Past Decade Social Benefits Paid by Government as % of GDP, 1999 vs. 2009 Dg mm mm — me me — ae a = = Hm a Q 0) 5 m= 2009 = 1999 Ry EET, NI m2 se aa me a ee sce ee est te see ea a a a a a & European Union 2009 Average = 17.1% o 2 —* -@2 -3 - ga -#)- 93 -» - g----------------: £ ° (0) > 2 Ko] @ a 10% | ili: i a 2 we a < C7) [a] & 5% T T ° ” Denmark Hungary Luxembourg Source: Eurostat. ‘Social Benefits’ include both social insurance (comparable to Social Security and Medicare) and social assistance benefits (comparable to Medicaid) provided by government units as well as all social insurance benefits provided KP under private funded and unfunded social insurance schemes, whether in cash or in kind. (@)E) www.kpcb.com USA Inc. | Consequences of Inaction 427 Austerity Measures to Take Away Entitlement Benefits Could Spark a Vicious Cycle ower nment Tax P www.kpcb.com USA Inc. | Consequences of Inaction 428 HOUSE_OVERSIGHT_021055
Page 233 - HOUSE_OVERSIGHT_021056
Social Unrest Can Shake Investor Confidence And Contagion Can Spread 10-Year Sovereign Yield Spread (over German Bonds) for Greece / Portugal / Spain / lreland, April 1 -— May 10, 2010 10% xs 5/6 — Greek parliament o formally approves austerity ——> & 8% package agreed w/ EU & IMF ——Greece aS E 4/22 — Greek civil servants @ stage a 24-hour strike g 6% —Portugal 4 | 3 - - o 5/5 — Violent protests in 5 Fy 4% Athens against proposed —spain 3S 9 austerity measures 2 2 =] 7) s 2% = Ireland = — @ a > Oe 4 0% i} T T T T T T T T T T T T 4/1 4/4 477 «@4110 413 4/16 4/19 4/22 4/25 4/28 5/1 5/4 5/7 p Source: FactSet. i USA Inc. | Consequences of Inaction 429 Government Deficits and Changes in Sovereign Credit Default Swap Rates = Positively Correlated Cumulative Government Deficits as % of GDP vs. Change in Sovereign CDS between 2007 and 2011E B00 -— nn nn nt @ Greece N = = 500 --------- ~~ === 5-582 nn ooo oo ooo aaa oan aa ao fo2) i=] oS N ra 400 @ ie) a BBY a a ee eee cee ami ene @ een one Smo Se a go Portugal . g¢ R? = 0.1996 ir] S 2 BDI =< oon sewer eeee fale. 232 es re a pem o= Ye = 5 e Ireland o - rm TOD) = sre cs ee 5 =e Frante~=—S—CS ee a Germany —@- ~~ Japan e UK —_ £ Py ——”~ @e Netherlands USA 5 0% 10% 20% 30% 40% 50% 60% = o 100 ---- ~~~ ~~ 5 oo nn nn nn an aaa a a a Cumulative Government Deficits as % of GDP for 2007-2011 (10-11 Projections) K p Sources: OECD; Markit; National Data a USA Inc. | Consequences of Inaction 430 HOUSE_OVERSIGHT_021056
Sponsored
Page 234 - HOUSE_OVERSIGHT_021057
When Corporations Like General Motors Run Out of Cash, Eventually They File for Bankruptcy General Motors Balance Sheet, 2000 —CQ1:09 6/09 — 3 Largest Bankruptcy Filing in USA History mas Cash & Marketable Securities am Assets (ex. Cash) mas Accrued Pension + OPEB Liabilities as Liabilities (ex. Pension & OPEB) =—O=—Net Worth (Shareholders’ Equity) Assets / Liabilities / Net Worth ($B) ce Note: *includes cash & equivalents, as well as marketable securities; **short-term debt also includes current portion of long- KP term debt. Source: General Motors. (@ 4] www.kpcb.com USA Inc. | Consequences of Inaction 431 General Motors — Entitlement Spending Became Too Onerous for this Great American Company 1908 — Founded in Flint, Michigan to manufacture automobiles 1954 — Shipped 50 millionth automobile 1988 — Free cash flow peaked at $6.3B 1999 — Reached a peak market capitalization of $61B 2006 — Revenue peaked at $207B 2009 — Filed for bankruptcy Why did GM file for bankruptcy? Products became increasingly uncompetitive. In addition, pension plans to support 650,000 retirees and their dependents (compared with 80,000 active employees in N. America as of 2010) rose to 4.8% of GM’s annual expenses and $4,679 in annual pension payments per worker to former workers. Source: General Motors, FactSet, DataStream, History News Network. www.kpcb.com USA Inc. | Consequences of Inaction 432 HOUSE_OVERSIGHT_021057
Page 235 - HOUSE_OVERSIGHT_021058
Comparing GM & USA, Inc... General USA 2010 Motors 2008 Gross Debt as % of GDP 93% 82% Gross Debt as % of Revenue’ Federal Spending as % of GDP 24 114 Total Cost as % of Revenue Federal Budget Surplus as % of GDP -9 -21 Net Income as % of Revenue Interest Payments as % of GDP 1 2 Interest Payments as % of Revenue % of Citizens Receiving Government 36 75 % of Total GM Population2 Subsidy or on Government Payroll Dependent on the company Note: 1) Gross debt of GM calculated as total liabilities — future OPEB & pension liabilities, as these liabilities are not reflected in USA gross debt. 2) % of total GM population dependent on the company = all living retirees / (living retirees + current workers). Source: White House Office of Management and Budget, OECD, Heritage Foundation, General Motors. www.kpcb.com USA Inc. | Consequences of Inaction 433 ...Good News for GM Is It Has ‘Taken Its Medicine’ and Has Begun to Implement a Successful Turnaround Basic Framework of GM Turnaround: e Focus on Expenses — Eliminated some of the legacy entitlements - swapped employee healthcare for equity ownership. — Significantly changed operating efficiency - took out costs so that GM was able to operate at breakeven at bottom of the cycle and turn cash flow positive during other parts of its business cycle. e Focus on Revenue — Changed business model to move away from lowering cost to improving vehicle quality, engineering and styling. KP www.kpcb.com USA Inc. | Consequences of Inaction 434 HOUSE_OVERSIGHT_021058
Page 236 - HOUSE_OVERSIGHT_021059
435 A436 HOUSE_OVERSIGHT_021059
Sponsored
Page 237 - HOUSE_OVERSIGHT_021060
www.kpcb.com USA Inc.| Summary 437 Highlights from F2010 USA Inc. Financials Summary — USA Inc. has challenges. Cash Flow — While recession depressed F2008-F2010 results, cash flow has been negative for 9 consecutive years ($4.8 trillion, cumulative), with no end to losses in sight. Negative cash flow implies that USA Inc. can't afford the services it is providing to 'customers,’ many of whom are people with few alternatives. Balance Sheet — Net worth is negative and deteriorating. Off-Balance Sheet Liabilities — Off-balance sheet liabilities of at least $31 trillion (primarily unfunded Medicare and Social Security obligations) amount to nearly $3 for every $1 of debt on the books. Just as unfunded corporate pensions and other post-employment benefits (OPEB) weigh on public corporations, unfunded entitlements, over time, may increase USA Inc.’s cost of capital. And today’s off-balance sheet liabilities will be tomorrow’s on-balance sheet debt. Conclusion — Publicly traded companies with similar financial trends would be pressed by shareholders to pursue a turnaround. The good news: USA Inc.’s underlying asset base and entrepreneurial culture are strong. The financial trends can shift toward a positive direction, but both ‘management’ and ‘shareholders’ will need collective focus, willpower, commitment, and sacrifice. Note: USA federal fiscal year ends in September, Cash flow = total revenue — total spending on a cash basis; net worth includes unfunded future liabilities from Social Security and Medicare on an accrual basis over the next 75 years. Source: cash flow per White House Office of Management and Budget; net worth per Dept. of Treasury, “2010 Financial Report of the U.S. Government,” adjusted to include unfunded liabilities of Social Security and Medicare. @ BE) www.kpcb.com USA Inc.| Summary 438 HOUSE_OVERSIGHT_021060
Page 238 - HOUSE_OVERSIGHT_021061
Drilldown on USA Inc. Financials... e To analysts looking at USA Inc. as a public corporation, the financials are challenged - Excluding Medicare / Medicaid spending and one-time charges, USA Inc. has supported a 4% average net margin’ over 15 years, but cash flow is deep in the red by negative $1.3 trillion last year (or -$11,000 per household), and net worth2 is negative $44 trillion (or -$371,000 per household). e The main culprits: entitlement programs, mounting debt, and one-time charges — Since the Great Depression, USA Inc. has steadily added “business lines” and, with the best of intentions, created various entitlement programs. Some of these serve the nation’s poorest, whose struggles have been made worse by the financial crisis. Apart from Social Security and unemployment insurance, however, funding for these programs has been woefully inadequate — and getting worse. - Entitlement expenses (adjusted for inflation) rose 70% over the last 15 years, and USA Inc. entitlement spending now equals $16,600 per household per year; annual spending exceeds dedicated funding by more than $71 trillion (and rising). Net debt levels are approaching warning levels, and one-time charges only compound the problem. - Some consider defense spending a major cause of USA Inc.'s financial dilemma. Re-setting priorities and streamlining could yield savings — $788 billion by 2018, according to one recent study*@ — perhaps without damaging security. But entitlement spending has a bigger impact on USA Inc. financials. Although defense nearly doubled in the last decade, to 5% of GDP, it is still below its 7% share of GDP from 1948 to 2000. It accounted for 20% of the budget in 2010, but 41% of all government spending between 1789 and 1930. Note: 1) Net margin defined as net income divided by total revenue; 2) net worth defined as assets (ex. stewardship assets like national parks and heritage assets like the Washington Monument) minus liabilities minus the net present value of unfunded entitlements (such as Social Security and Medicare), data per Treasury Dept.'s “2010 Annual Report on the U.S. Government’, 3) Gordon Adams and Matthew Leatherman, “A Leaner and Meaner National Defense,” Foreign Affairs, Jan/Feb 2011) (@)E) www.kpcb.com USA Inc. | Summary 439 ...Drilldown on USA Inc. Financials... e Medicare and Medicaid, largely underfunded (based on ‘dedicated’ revenue) and growing rapidly, accounted for 21% (or $724B) of USA Inc.’s total expenses in F2010, up from 5% forty years ago - Together, these two programs represent 35% of all (annual) US healthcare spending; Federal Medicaid spending has doubled in real terms over the last decade, to $273 billion annually. e Total government healthcare spending consumes 8.2% of GDP compared with just 1.3% fifty years ago; the new health reform law could increase USA Inc.’s budget deficit - As government healthcare spending expands, USA Inc.’s red ink will get much worse if healthcare costs continue growing 2 percentage points faster than per capita income (as they have for 40 years). e Unemployment Insurance and Social Security are adequately funded...for now. The future, not so bright - Demographic trends have exacerbated the funding problems for Medicare and Social Security — of the 102 million increased enrollment between 1965 and 2009, 42 million (or 41%) is due to an aging population. With a 26% longer life expectancy but a 3% increase in retirement age (since Social Security was created in 1935), deficits from Social Security could add $11.6 trillion (or 140%) to the public debt by 2037E, per Congressional Budget Office (CBO). KP a USA Inc. | Summary 440 HOUSE_OVERSIGHT_021061
Page 239 - HOUSE_OVERSIGHT_021062
...Drilldown on USA Inc. Financials e If entitlement programs are not reformed, USA Inc.’s balance sheet will go from bad to worse - Public debt has doubled over the last 30 years, to 62% of GDP. This ratio is expected to surpass the 90% threshold* — above which real GDP growth could slow considerably — in 10 years and could near 150% of GDP in 20 years if entitlement expenses continue to soar, per CBO. - As government healthcare spending expands, USA Inc.’s red ink will get much worse if healthcare costs continue growing 2 percentage points faster than per capita income (as they have for 40 years). e The turning point: Within 15 years (by 2025), entitlements plus net interest expenses will absorb all — yes, all — of USA Inc.’s annual revenue, per CBO - That would require USA Inc. to borrow funds for defense, education, infrastructure, and R&D spending, which today account for 32% of USA Inc. spending (excluding one-time items), down dramatically from 69% forty years ago. - It's notable that CBO’s projection from 10 years ago (in 1999) showed Federal revenue sufficient to support entitlement spending + interest payments until ZOG0E — 35 years later than current projection. Note: *Carmen Reinhart and Kenneth Rogoff observed from 3,700 historical annual data points from 44 countries that the relationship between government debt and real GDP growth is weak for debt/GDP ratios below a threshold of 90 percent of GDP. Above 90 percent, median growth rates fall by one percent, and average growth falls considerably more. We note that while Reinhart and Rogoff’s observations are based on ‘gross debt’ data, in the U.S., debt held by the public is closer to the European KP countries’ definition of government gross debt. For more information, see Reinhart and Rogoff, “Growth in a Time of Debt,” 1/10. (@)E) www.kpcb.com USA Inc.| Summary 441 How Might One Think About Turning Around USA Inc.?... e Key focus areas would likely be reducing USA Inc.’s budget deficit and improving / restructuring the ‘business model’... — One would likely drill down on USA Inc.’s key revenue and expense drivers, then develop a basic analytical framework for ‘normal’ revenue / expenses, then compare options. Looking at history... — Annual growth in revenue of 3% has been roughly in line with GDP for 40 years* while corporate income taxes grew at 2%. Social insurance taxes (for Social Security / Medicare) grew 5% annually and now represent 37% of USA Inc. revenue, compared with 19% in 1965. — Annual growth in expenses of 3% has been roughly in line with revenue, but entitlements are up 5% per annum - and now absorb 51% of all USA Inc.’s expense - more than twice their share in 1965; defense and other discretionary spending growth has been just 1-2%. One might ask... — Should expense and revenue levels be re-thought and re-set so USA Inc. operates near break-even and expense growth (with needed puts and takes) matches GDP growth, thus adopting a ‘don’t spend more than you earn’ approach to managing USA Inc.'s financials? Note: *We chose a 40-year period from 1965 to 2005 to examine ‘normal’ levels of revenue and expenses. We did not choose the most recent 40-year period (1969 to 2009) as USA was in deep recession in 2008 / 2009 and underwent significant tax policy fluctuations in 1968 /1969, so KP many metrics (like individual income and corporate profit) varied significantly from ‘normal’ levels. (@E) www.kpcb.com USA Inc.| Summary 442 HOUSE_OVERSIGHT_021062
Sponsored
Page 240 - HOUSE_OVERSIGHT_021063
... ow Might One Think About Turning Around USA Inc.? One might consider... e Options for reducing expenses by focusing on entitlement reform and operating efficiency — Formula changes could help Social Security's underfunding, but look too draconian for Medicare/Medicaid; the underlying healthcare cost dilemma requires business process restructuring and realigned incentives. - Resuming the 20-year trend line for lower Federal civilian employment, plus more flexible compensation systems and selective local outsourcing, could help streamline USA Inc.’s operations. e Options for increasing revenue by focusing on driving long-term GDP growth and changing tax policies - USA Inc. should examine ways to invest in growth that provides a high return (ROI) via new investment in technology, education, and infrastructure and could stimulate productivity gains and employment growth. — Reducing tax subsidies (like exemptions on mortgage interest payments or healthcare benefits) and changing the tax system in other ways could increase USA Inc.’s revenue without raising income taxes to punitive — and self-defeating — levels. Such tax policy changes could help re-balance USA’s economy between consumption and savings and re-orient business lines towards investment-led growth, though there are potential risks and drawbacks. e History suggests the long-term consequences of inaction could be severe - USA Inc. has many assets, but it must start addressing its spending/debt challenges now. KP i USA Inc. | Summary 443 Sizing Costs Related to USA Inc.’s Key Financial Challenges & Potential AND / OR Solutions e To create frameworks for discussion, the next slide summarizes USA Inc.’s various financial challenges and the projected future cost of each main expense driver. — The estimated future cost is calculated as the net present value of expected ‘dedicated’ future income (such as payroll taxes) minus expected future expenses (such as benefits paid) over the next 75 years. e Then we ask the question: ‘What can we do to solve these financial challenges?’ — The potential solutions include a range of simple mathematical illustrations (such as changing program characteristics or increasing tax rates) and/or program-specific policy solutions proposed or considered by lawmakers and agencies like the CBO (such as indexing Social Security initial benefits to growth in cost of living). e These mathematical illustrations are only a mechanical answer to key financial challenges and not realistic solutions. In reality, a combination of detailed policy changes will likely be required to bridge the future funding gap. KP a USA Inc. | Summary 444 HOUSE_OVERSIGHT_021063
Page 241 - HOUSE_OVERSIGHT_021064
Overview of USA Inc.’s Key Financial Challenges & Potential and/or Solutions Financial Net Present Cost! Mathematical Illustrations Rank Challenge ($T / % of 2010 GDP) and/or Potential Policy Solutions? * Isolate and address the drivers of medical cost inflation 1 Medicaid $35 Trillion? / 239% — * Improve efficiency / productivity of healthcare system ¢ Reduce coverage for optional benefits & optional enrollees « Reduce benefits ¢ Increase Medicare tax rate : Metis ce en eee Isolate and address the drivers of medical cost inflation ¢ Improve efficiency / productivity of healthcare system * Raise retirement age * Reduce benefits Social 5 * Increase Social Security tax rate : Security oS MIN Snes ¢ Reduce future initial benefits by indexing to cost of living growth rather than wage growth * Subject benefits to means test to determine eligibility vn GDP / * Invest in technology / infrastructure / education 4 -- * Remove tax & regulatory uncertainties to stimulate employment growth Revenue * Reduce subsidies and tax expenditures & broaden tax base Growth Govemment ¢ Resume the 20-year trend line for lower Federal civilian employment 5 oe oe * Implement more flexible compensation systems Inefficiencies ‘ : : . * Consolidate / selectively local outsource certain functions Note: 1) Net Present Cost is calculated as the present value of expected future net liabilities (expected revenue minus expected costs) for each program / issue over the next 75 years, Medicare estimate per Dept. of Treasury, “2010 Financial Report of the U.S. Government,” Social Security estimate per Social Security Trustees’ Report 4 Pe 2) For more details on potential solutions, see slides 252-410 or full USA Inc. presentation. 3) Medicaid does not have dedicated revenue source and its $35T net present cost excludes funding from general tax revenue, NPV analysis based on 3% discount rate applied to CBO’s projection for annual inflation-adjusted expenses. www.kpcb.com USA Inc.| Summary 445 The Essence of America’s Financial Conundrum & Math Problem? While a hefty 80% of Americans indicate balancing the budget should be one of the country’s top priorities, per a Peter G. Peterson Foundation survey in 11/09... ...only 12% of Americans support cutting spending on Medicare or Social Security, per a Pew Research Center survey, 2/11. Some might call this ‘having your cake and eating it too...’ P a USA Inc. | Summary 446 HOUSE_OVERSIGHT_021064
Page 242 - HOUSE_OVERSIGHT_021065
The Challenge Before Us Policymakers, businesses and citizens need to share responsibility for past failures and develop a plan for future successes. Past generations of Americans have responded to major challenges with collective sacrifice and hard work. Will ours also rise to the occasion? KP i USA Inc. | Summary 447 Current Observations About America... ¢ On many fronts, USA Inc. is in great shape, but it has one big problem — USA Inc. spends too much and, in effect, is maxing out its credit card. USA Inc. must address the problem. ° In 2009, 64% of America’s revenue went to Social Security, Medicare & Medicaid, compared with 31% in 1980 and 20% in 1970. ¢ Using current projections, 100% of America’s revenue in 2025 will go to Social Security, Medicare, Medicaid and Net Interest Expense. ¢ This raises the question, ‘How will America pay for the likes of education, national defense, homeland security, infrastructure improvement, R&D, law enforcement, postal service, etc.?’ ¢ USA Inc.’s fundamental tradeoff is that it must balance its FUTURE (education) with its PRESENT (national defense & homeland security) and its PAST (Social Security & Medicare & Medicaid). Source: 2009 data per White House OMB, 2025 forecast per CBO’s Alternative Fiscal Scenario. a USA Inc. | Summary 448 HOUSE_OVERSIGHT_021065
Sponsored
Page 243 - HOUSE_OVERSIGHT_021066
...current Observations About America ¢ It’s Time to Rise to the Occasion, It’s America’s Tradition... ¢ The essence of the ‘American dream’ is about the underdog succeeding / the turnaround story...every generation or so has an opportunity to rise to an occasion (and sacrifice) and show why America (and its democratic form of government) are great. For this generation, the biggest challenge may be staving off financial hardship. ¢ Collective Sacrifice and Hard Work are the Two Inter- Related Ways out of USA Inc.’s Problems... KP i USA Inc. | Summar: y 449 450 HOUSE_OVERSIGHT_021066
Page 244 - HOUSE_OVERSIGHT_021067
452 HOUSE_OVERSIGHT_021067
Page 245 - HOUSE_OVERSIGHT_021068
Appendix if Dp i USA Inc. | Appendix 453 Appendix Additional Datapoints on Federal Debt KK: CB www.kpcb.com USA Inc. | Appendix 454 HOUSE_OVERSIGHT_021068
Sponsored
Page 246 - HOUSE_OVERSIGHT_021069
Federal Debt Held by the Public vs. Gross Debt e Federal Debt Held by the Public ($9 Trillion Outstanding, 62% of GDP in 2010) - Value of all federal securities sold to the public that are still outstanding. - Represents the cumulative effect of past federal borrowing on today’s economy and on the current federal budget. - Net interest payments represent a burden on current taxpayers. e Gross Debt ($14 Trillion Outstanding, 94% of GDP in 2010) - Public debt + intragovernmental debt (related to entities including the Social Security Trust Fund and federal employee / veterans’ pension fund) + net liability of GSEs (related to likes of Fannie Mae and Freddie Mac). - Represents a claim on both current and future resources. e We Focus on Public Debt Levels - Public debt is the base for calculating net interest payments. - Gross debt level could be misleading (to take an extreme example, simply eliminating all trust funds without changing promised benefits for the associated programs would dramatically reduce gross debt from 94% of GDP to 62% of GDP without improving long- term fiscal outlook at all*). - In the future, when intragovernmental debt + net liability of GSEs begin demanding repayments, it is likely financed via material increases in public debt levels. Note: *for more details, see James R. Horney, “Recommendation That President’s Fiscal Commission Focus on Gross Debt is isquided, . Data source: White House , . Misguided,” 5/27/10. Dat: White He OMB, CBO. www.kpcb.com ne. | Appendix B kpeb USA Inc. | Al dix 455 Public Debt = Gross Debt — Intra-Governmental Holdings — Net Liabilities of Government-Sponsored Enterprises (GSEs) 1960 2010 Real Gross Debt Real Gross Debt Outstanding = Outstanding = $2.0 Trillion $13.5 Trillion Net Liabilities of GSEs* Public Debt $9.0T Public Debt $1.7T Other Intragovernmental Other ™~ Holdings Intragovernmental Holdings Social Security 9% Trust Fund 6% Debt Held By the Public F P 5 Debt Held By oad oe 62% the Public even FUR 85% Note: Data are inflation adjusted.* Net liabilities of GSEs assumes 50% loss ratio on $250B delinquent loans held by Fannie KP Mae / Freddie Mac. Data source: Dept. of Treasury, White House Office of Management and Budget. (@E) www.kpcb.com USA Inc. | Appendix 456 HOUSE_OVERSIGHT_021069
Page 247 - HOUSE_OVERSIGHT_021070
Gross Debt Level = Approaching 100% of GDP USA Gross Federal Debt as % of GDP, 1940 — 2010 FIT wm — ee a = es me nn = i me Hs Ss 100% 80% 60% Debt Held By the Public Gross Debt As % of GDP 40% 20% 0% [ T T T T T T T 1940 1946 1952 1958 1964 1970 1976 1982 1988 1994 2000 2006 KP. Source: White House OMB. i USA Inc. | Appendix 457 Gross Debt Level = Would Exceed Current Statutory Limit of $1.43T* Within One Year USA Gross Federal Debt vs. Statutory Debt Ceiling, 1990 — 2011E PREG wen mem = ec eae mie en em = ne a ET TC a mag USA Inc. Gross Debt Statutory Debt Limit 12,000 ---- 10,000 ----------- +--+ 22 nee ee ee ne eee 8000 -------- +--+ +2222 2222 ee ee eee ee eee eee eee ee eens. Gross Debt ($B) 6,000 -------- +--+ + 2-22 eee 4,000 2,000 0 1990 1992 1994 1996 1998 2000 2002 2004 2006 2008 2010E KP Note: * As of 1/11. Source: White House OMB. CB www.kpcb.com USA Inc. | Appendix 458 HOUSE_OVERSIGHT_021070
Page 248 - HOUSE_OVERSIGHT_021071
‘Top 75’ Countries Ranked by Net Debt as % of GDP... 2009 Net Debt Rank Country Outstanding ($B) YY As % of World Total Net Debt as % of GDP 05-09 | 2009 GDP Change 2009 2005 YIY As%of 2009 Budget World Surplus / Total Deficit ($B) As % of World Gross Unemploy- Deficit 2009 ment Rate YIY (pps) Zimbabwe 13% Japan 12 Italy 0 Singapore Greece Egypt Belgium Sudan Hungary Cote d'ivoire France Portugal Germany Austria India Uruguay UK Canada Netherlands Morocco Ireland Albania Argentina Philippines 25 USA On naabk whr = = o @ Top 1-25 Global (@)E) www.kpcb.com $29,836 1% 34,632 8 Np n esertooos WRONFAFANO MOC SOA =H =H HN 86% 100 55 37 17 14,266 15% 67% 8%) $35,595 68 66 2 57,937 -2 2% 2 esecooeoseNMNhONMAaAtmMoamcocmcrmcmcRBRTMCOOCcrRBRCcCOCUcRCUC 25 61% 100 $2,662 2,886 Source: IMF, Business Intelligence Monitor . 92% 100 8% 7 USA Inc. | Appendix 459 2009 Net Debt Rank Country Outstanding ($B) YY As % of World Total Net Debt as % of GDP 05-09 | 2009 GDP 2009 2005 Change YIY As%of 2009 Budget World Surplus / Total Deficit ($B) As % of World Gross Unemploy- Deficit 2009 ment Rate YIY (pps) Tunisia Ethiopia Colombia Cyprus Poland Spain Kenya Norway Ghana Bolivia Sweden Brazil Switzerland Latvia Malawi Malaysia Denmark Gabon Finland Turkey Czech Republic Slovenia Slovakia Croatia Australia 3 BS fe coocooecees Ce eee eC HFN OC HB ON | OO f& 68 47 43 45 46 51 44 53 12 44 38 42 52 30 27 44 38 36 Noococe fc ee HC CCH WH OO RsB ON 0 SC & Top 26-50 Global (@E) www.kpcb.com 0% 10% 8 100 44% -2% 66 -2 13% 100 $164 6% 6% 2,886 100 7 Source: IMF, Business Intelligence Monitor. USA Inc. | Appendix 460 HOUSE_OVERSIGHT_021071
Sponsored
Page 249 - HOUSE_OVERSIGHT_021072
... lop 75’ Countries Ranked by Net Debt as % of GDP As % of As %of 2009 Budget As % of 2009 2009 Net Debt World 2009 GDP World Surplus/ WorldGross Unemploy- Y/Y Rank Country Outstanding ($B) YN Total 2009 2005 Change YIY Total Deficit ($B) Deficit ment Rate (pps) Zambia Macedonia Ecuador Lithuania Peru South Africa Paraguay Venezuela New Zealand Thailand Namibia Tanzania Senegal Mozambique Romania Uganda Bulgaria Nigeria Angola Cameroon China Kazakhstan Algeria Russia Estonia Oonmob hoo Fb FB4HuvbanbOKHKEES : & vu & @ eooocoonNnNiocooccoeocceeec eo eco eco eo ee eo ce eo Se = ~ oN COC @Mcc ce ecececeeceece se Be oOo OC eo Oo Se 6 Top 51-75 0% 14% $60 2% Global -2 100 2,886 100 Note: China’s net debt may be under-reported as it excludes potential liabilities from bad loans of state-owned banks. KP Source: IMF, Business Intelligence Monitor. (@)E) www.kpcb.com USA Inc. | Appendix 461 OECD Countries Ranked by Gross Debt as % of GDP Gross Debt as % of GDP As % of 05-09 2009 GDP 2009 Gross Debt As % of Rank Country Outstanding ($B) YIY OECD Total 2009 2005 Change ($B) YY OECD Total 1 Japan $974 14% 27% 193% 175% $5,049 -5% 13% 2 Italy 269 1 7 129 120 9 2,090 5 5 3 Iceland 1 8 0 123 53 12 -28 0 4 Greece 40 8 1 338 -2 1 5 Belgium 47 -1 1 461 -3 1 6 Portugal 19 4 1 220 -3 1 7 France 227 5 6 2,635 -2 7 8 Hungary 10 -13 0 124 6 0 9 USA 1,184 17 32 14,266 -2 36 10 Canada 109 4 3 1,319 -3 3 11. Germany 247 -2 7 3,235 -6 8 12 UK 159 4 4 2,198 5 6 13 Austria 26 4 1 374 4 1 14 Ireland 16 23 0 227 7 1 15 Netherlands 54 6 1 790 4 2 16 Spain 90 18 2 1,438 -4 4 17 Poland 25 -14 1 423 2 1 18 Finland 13 15 (t] 242 -8 1 19 Denmark 16 11 tt) 308 5 1 20 Sweden 21 8 1 398 -4 1 21 Norway 18 -28 C1) 369 -2 1 22 Czech Republic 8 2 0 190 -4 0 23 Switzerland 20 6 1 484 -1 1 24 Slovakia 3 17 0 88 5 0 25 New Zealand 4 3 0 110 -2 0 26 Korea 29 -3 1 833 -11 2 27 ~=Australia 18 28 0 920 1 2 28 Luxembourg 1 -§ 0 52 -11 0 OECD Total $3,648 9% 100% 90% 76% 14%) $39,261 4% 100% Note: Data for Slovenia and Estonia not available. Data may differ from Eurostat / national government figures. Gross debt data are not always comparable across countries due to different definitions or treatment of debt components. Notably, USA and Australia gross debt include the funded portion of government employee KP pension liabilities, which overstates their debt levels relative to other countries. Source: OECD. (@E) www.kpcb.com USA Inc. | Appendix 462 HOUSE_OVERSIGHT_021072
Page 250 - HOUSE_OVERSIGHT_021073
Total Government + Private Debt in USA — At Historic High of 360% of GDP USA Total Credit Market Debt Outstanding as % of GDP, 1929 — 2009 350% 300% 250% 200% 150% 100% U.S. Credit Market Debt / GDP (%) 50% 0% 1929 1934 1939 1944 1949 1954 1959 1964 1969 1974 1979 1984 1989 1994 1999 2004 2009 m Households a Corporates g Financials a GSE m Government KP Source: Dept. of Treasury, Federal Reserve. (@)E) www.kpcb.com USA Inc. | Appendix 463 Appendix Useful Links KP a USA Inc. | Appendix 464 HOUSE_OVERSIGHT_021073
Page 251 - HOUSE_OVERSIGHT_021074
Appendix — Useful Links e Congressional Budget Office, “The Long-Term Budget Outlook,” 6/2010 e Congressional Budget Office, “Budget and Economic Outlook, Fiscal Years 2011 Through 2021,” 1/2011 e Department of Health & Human Services, Centers for Medicare & Medicaid Services, “The 2010 Annual Report of the Board of Trustees of the Federal Hospital Insurance and Federal Supplementary Medical Insurance Trust Funds,” 8/5/2010 e Department of the Treasury, “2010 Financial Report of the United States Government,” 12/2010 e National Commission on Fiscal Responsibility and Reform, “The Moment of Truth: Report of the National Commission on Fiscal Responsibility and Reform,” 12/1/2010 e Social Security Administration, “The 2010 Annual Report of the Board of Trustees of the Federal Old-Age and Survivors Insurance and Federal Disability Insurance Trust Funds,” 8/9/2010 e White House Office of Management and Budget, “Budget of the United States Government, Fiscal Year 2012,” 2/2011 KP i USA Inc. | Appendix 465 This report has been compiled by Mary Meeker and her co-contributors (collectively referred to below as the “Contributors”) for informational purposes only. It is not intended to serve as the basis for investment, legal, political, tax or any other advice. Furthermore, this report is not to be construed as a solicitation or an offer to buy or sell securities in any entity, including any entity that is associated with the Contributors. The information contained in this report has been compiled from public sources that the Contributors believe to be reliable. While the Contributors find no reason to believe that the data relied upon and presented in this report are factually incorrect, they have made no separate investigation or otherwise independently verified the accuracy of such data. As such, the Contributors cannot guarantee the accuracy of any of the data (raw or interpreted) and accordingly the Contributors make no warranties (express, implied or statutory) as to the information in this report. This report summarizes a significant amount of publicly available data, and is not intended to be all- inclusive. The Contributors have complied this report based on selected sources that they believe to be most pertinent to the presented subject matter. Furthermore, the graphic illustrations are based on generalized calculations and are provided for illustrative purposes. Readers are encouraged to conduct their own analysis of the data underlying this report, as well as data from other sources, so as to come to their own conclusions. The information presented in this report represents the view of the Contributors, and does not necessarily reflect the views of Kleiner Perkins Caufield & Byers or any of its associated management personnel, investment vehicles, investors, portfolio companies or any affiliates or associates of the foregoing. KP a USA Inc. | Appendix 466 HOUSE_OVERSIGHT_021074
Sponsored
Page 252 - HOUSE_OVERSIGHT_021075
A467 468 HOUSE_OVERSIGHT_021075
Page 253 - HOUSE_OVERSIGHT_021076
Glossary Accountable Care Organization (ACO) - A health system model with the ability to provide, and manage with patients, the continuum of care across different institutional settings, including at least ambulatory (outpatient) and inpatient hospital care and possibly post acute care. ACOs have the capability of planning budgets and resources and are of sufficient size to support comprehensive, valid, and reliable performance measurement. The ACO model is one of the latest designs for managing healthcare costs and especially Medicare costs, and is gaining traction among policymakers desperate to control costs and boost quality in healthcare. Accrual accounting - A system of accounting in which revenues are recorded when they are earned and outlays are recorded when goods are received or services are performed, even though the actual receipt of revenues and payment for goods or services may occur, in whole or in part, at a different time. Compare with cash accounting. Adjusted Gross Income (AGI) - All income that is subject to taxation under the individual income tax after "above-the-line" deductions for such things as alimony payments and certain contributions to individual retirement accounts. Personal exemptions and the standard or itemized deductions are subtracted from AGI to determine taxable income www.kpcb.com Alternative Minimum Tax (AMT) - A tax intended to limit the extent to which higher- income people can reduce their tax liability (the amount they owe) through the use of preferences in the tax code. Taxpayers subject to the AMT are required to recalculate their tax liability on the basis of a more limited set of exemptions, deductions, and tax credits than would normally apply. The amount by which a taxpayer’s AMT calculation exceeds his or her regular tax calculation is that person’s AMT liability. American Recovery and Reinvestment Act of 2009 (ARRA) - This act provided appropriations for several federal programs and increased or extended some benefits payable under Medicaid, unemployment compensation, and nutrition assistance, among others. ARRA also reduced individual and corporate income taxes and made other changes to tax laws. Asset-Backed Security - Security backed by real estate or another type of asset; a claim on an income flow, such as expected interest payments on loans, payments on leases, royalty payments, or receivables; a claim on the principal of a loan; or a claim on the expected appreciation of an asset. Automatic Stabilizers - Taxes that decrease and expenditures that increase when the economy goes into a recession (and vice-versa when the economy booms) without requiring any action on the part of the government. Stabilizers tend to reduce the depth of recessions and dampen booms. USAInc. xix HOUSE_OVERSIGHT_021076
Page 254 - HOUSE_OVERSIGHT_021077
Bundled Payment (Healthcare) - Also known as episode-based payment, defined as the reimbursement of health care providers (such as hospitals and physicians) on the basis of expected costs for clinically- defined episodes of care. It has been described as "a middle ground" between fee-for-service reimbursement (in which providers are paid for each service rendered to a patient) and capitation (in which providers are paid a "lump sum" per patient regardless of how many services the patient receives). Business Cycle - Fluctuations in overall business activity accompanied by swings in the unemployment rate, interest rates, and corporate profits. Over a business cycle, real (inflation-adjusted) activity rises to a peak (its highest level during the cycle) and then falls until it reaches a trough (its lowest level following the peak), whereupon it starts to rise again, defining a new cycle. Business cycles are irregular, varying in frequency, magnitude, and duration. (NBER) See real and unemployment rate. Cash Accounting - A system of accounting in which revenues are recorded when they are actually received and outlays are recorded when payment is made. Compare with accrual accounting. Centers for Medicare & Medicaid Services (CMS) — US federal agency which administers Medicare, Medicaid, and the Children's Health Insurance Program. Copayment — A flat amount paid out of pocket per medical service, e.g., $5 per office visit. Congressional Budget Office (CBO) —A non-partisan federal agency within the legislative branch of the U.S. government, charged with reviewing congressional budgets and other legislative initiatives with budgetary implications. _) Ise) www.kpcb.com Conservatorship - The legal process by which an external entity (in the case of Fannie Mae and Freddie Mac, the federal government) establishes control and oversight of a company to put it in a sound and solvent condition. Consumption - In principle, the value of goods and services purchased and used up during a given period by households and governments. In practice, the Bureau of Economic Analysis counts purchases of many long-lasting goods (such as cars and clothes) as consumption even though the goods are not used up. Consumption by households alone is also called consumer spending. See national income and product accounts. Cost-of-Living Adjustment (COLA) - An annual increase in Social Security and other entitlement payments to reflect price inflation. Current-Account Balance - A summary measure of a country’s current transactions with the rest of the world, including net exports, net unilateral transfers, and net factor income (primarily the capital income from foreign property received by residents of a country offset by the capital income from property in that country flowing to residents of foreign countries). Cyclical Deficit or Surplus - The part of the federal budget deficit or surplus that results from the business cycle. The cyclical component reflects the way in which the deficit or surplus automatically increases or decreases during economic expansions or recessions. Cyclically Adjusted Budget Deficit or Surplus - The federal budget deficit or surplus that would occur under current law if the influence of the business cycle was removed—that is, if the economy operated at potential gross domestic product. USAInc. Xx HOUSE_OVERSIGHT_021077
Sponsored
Page 255 - HOUSE_OVERSIGHT_021078
Debt - In the case of the federal government, the total value of outstanding bills, notes, bonds, and other debt instruments issued by the Treasury and other federal agencies. That debt is referred to as federal debt or gross debt. It has two components - debt held by the public ( federal debt held by nonfederal investors, including the Federal Reserve System) and debt held by government accounts (federal debt held by federal government trust funds, deposit insurance funds, and other federal accounts). Debt subject to limit is federal debt that is subject to a statutory limit on the total amount issued. The limit applies to gross federal debt except for a small portion of the debt issued by the Treasury and the small amount of debt issued by other federal agencies (primarily the Tennessee Valley Authority and the Postal Service). Deductible (Medical Insurance) - A fixed amount, usually expressed in dollars in the form of an annual fee, that the beneficiary of a health insurance plan must pay directly to the health care provider before a health insurance plan begins to pay for any costs associated with the insured medical service. Deficit - The amount by which the federal government's total outlays exceed its total revenues in a given period, typically a fiscal year. The primary deficit is that total deficit excluding net interest. Defined Benefit Pension Plan — Retirees receive predetermined monthly retirement benefits from employers despite the funding status / investment returns of their pension funds. Defined Contribution Pension Plan — Retirees contribute specified amount to their pension funds and receive variable monthly retirement benefits depending on investment returns. Examples include Individual Retirement Accounts (IRAs) and 401(k) plans. _) Ise) www.kpcb.com Disposable Personal Income - Personal income—the income that people receive, including transfer payments—minus the taxes and fees that people pay to governments. Economic Stimulus - Federal fiscal or monetary policies aimed at promoting economic activity, used primarily during recessions. Such policies include reductions in taxes, increases in federal spending, reductions in interest rates, and other support for financial markets and institutions. Entitlement - A legal obligation of the federal government to make payments to a person, group of people, business, unit of government, or similar entity that meets the eligibility criteria set in law and for which the budget authority is not provided in advance in an appropriation act. Spending for entitlement programs is controlled through those programs’ eligibility criteria and benefit or payment rules. The best-known entitlements are the government’s major benefit programs, such as Social Security and Medicare. Excise Tax - A tax levied on the purchase of a specific type of good or service, such as tobacco products or air transportation services. Federal Poverty Level (FPL) - Income amounts set each February by the U.S. Department of Health and Human Services used to determine an individual's or family's eligibility for various public programs, including Medicaid and the State Children's Health Insurance Program. Federal Reserve System - The central bank of the United States. The Federal Reserve is responsible for setting the nation’s monetary policy and overseeing credit conditions. See central bank and monetary policy. USA Inc. xxi HOUSE_OVERSIGHT_021078
Page 256 - HOUSE_OVERSIGHT_021079
Fiscal Policy - The government’s tax and spending policies, which influence the amount and maturity of government debt as well as the level, composition, and distribution of national output and income. See debt. Fiscal Year - A yearly accounting period. The federal government's fiscal year begins October 1 and ends September 30. Fiscal years are designated by the calendar years in which they end—for example, fiscal year 2011 will begin on October 1, 2010, and end on September 30, 2011. GDP price index - A summary measure of the prices of all goods and services that make up gross domestic product. The change in the GDP price index is used as a measure of inflation in the overall economy. General Fund - One category of federal funds in the government’s accounting structure. The general fund records all revenues and offsetting receipts not earmarked by law for a specific purpose and all spending financed by those revenues and receipts. Government-Sponsored Enterprise (GSE) - A financial institution created by federal law, generally though a federal charter, to carry out activities such as increasing credit availability for borrowers, reducing borrowing costs, or enhancing liquidity in particular sectors of the economy, notably agriculture and housing. Two housing GSEs (Fannie Mae and Freddie Mac) were taken into federal conservatorship in 2008. Health Maintenance Organization (HMO) - A managed care plan that combines the function of insurer and provider to give members comprehensive health care from a network of affiliated providers. Enrollees typically pay limited copayments and are _) Ise) www.kpcb.com usually required to select a primary care physician through whom all care must be coordinated. HMOs generally will not reimburse all costs for services obtained from a non-network provider or without a primary care physician's referral. HMOs often emphasize prevention and careful assessment of medical necessity. Independent Payment Advisory Board (IPAB) - A 15-member Independent Payment Advisory Board created under PPACA with significant authority with respect to Medicare payment rates. Beginning in 2014, in any year in which the Medicare per capita growth rate exceeded a target growth rate, the IPAB would be required to recommend Medicare spending reductions. The recommendations would become law unless Congress passed an alternative proposal that achieved the same level of budgetary savings. Subject to some limitations—hospitals, for example, would be exempt until 2020—the IPAB could recommend spending reductions affecting Medicare providers and suppliers, as well as Medicare Advantage and Prescription Drug Plans. Labor Force - The number of people age 16 or older in the civilian non-institutional population who have jobs or who are available for work and are actively seeking jobs. (The civilian non-institutional population excludes members of the armed forces on active duty and people in penal or mental institutions or in homes for the elderly or infirm.) The labor force participation rate is the labor force as a percentage of the civilian non-institutional population age 16 or older. Marginal Tax Rate - The tax rate that would apply to an additional dollar of a taxpayer's income. Compare with effective tax rate and statutory tax rate. USA Inc. xxii HOUSE_OVERSIGHT_021079
Page 257 - HOUSE_OVERSIGHT_021080
Medicaid - Public health insurance program that provides coverage for low-income persons for acute and long-term care. It is financed jointly by state and federal funds (the federal government pays at least 50 percent of the total cost in each state) and is administered by states within broad federal guidelines. Medicare - Federal health insurance program for virtually all persons age 65 and older, and permanently disabled persons under age 65, who qualify by receiving Social Security Disability Insurance. Mortgage-Backed Securities (MBSs) - Securities issued by financial institutions to investors with the payments of interest and principal backed by the payments on a package of mortgages. MBSs are structured by their sponsors to create multiple classes of claims, or tranches, of different seniority, based on the cash flows from the underlying mortgages. Investors holding securities in the safest, or most senior, tranche stand first in line to receive payments from borrowers and require the lowest contractual interest rate of all the tranches. Investors holding the least senior securities stand last in line to receive payments, after all more senior claims have been paid. Hence, they are first in line to absorb losses on the underlying mortgages. In return for assuming that risk, holders of the least senior tranche require the highest contractual interest rate of all the tranches. National Commission on Fiscal Responsibility and Reform - A bipartisan commission created by President Obama to address the nation's fiscal challenges. The Commission is charged with identifying policies to improve the fiscal situation in the medium term and to achieve fiscal sustainability over the long run. Specifically, the Commission shall propose _) Ise) www.kpcb.com recommendations designed to balance the budget, excluding interest payments on the debt, by 2015. In addition, the Commission shall propose recommendations that meaningfully improve the long-run fiscal outlook, including changes to address the growth of entitlement spending and the gap between the projected revenues and expenditures of the Federal Government. Net Interest - In the federal budget, net interest comprises the government’s interest payments on debt held by the public (as recorded in budget function 900), offset by interest income that the government receives on loans and cash balances and by earnings of the National Railroad Retirement Investment Trust. See budget function and debt. Office of Management and Budget (OMB) — White House office responsible for devising and submitting the president’s annual budget proposal to Congress. Organization for Economic Co-operation and Development (OECD) — An international organization of 31 developed and emerging countries (see list on slide 354) with a shared commitment to democracy and the market economy. Other Post-Employment Benefits (OPEB) — An accounting concept created by the Governmental Accounting Standards Board (GASB) by pronouncements designed to address expenses that entities may or may not be legally bound to pay, but pay as a moral obligation (such as retirees’ healthcare costs). Pay-As-You-Go (PAYGO) - Procedures established in House and Senate rules that are intended to ensure that laws that affect direct spending or revenues are budget neutral. The Senate and the House have had such rules in place since 1993 and 2007, respectively. USA Inc. xxiii HOUSE_OVERSIGHT_021080
Sponsored
Page 258 - HOUSE_OVERSIGHT_021081
PEP / Pease (Tax Policy) - PEP is Personal Exemption Phase-out designed to eliminate personal income exemptions for high earners; 3) Pease is a similar phase-out, but instead of applying to personal exemption, it applies to most of the itemized deductions of a taxpayer’s claims (mortgage interest, charitable gifts, state & local taxes paid, etc.); Pease is named after Representative Donald Pease (D-OH) who pushed for its enactment in 1990. Present Value - A single number that expresses a flow of current and future income (or payments) in terms of an equivalent lump sum received (or paid) today. The present value depends on the rate of interest used (the discount rate). For example, if $100 is invested on January 1 at an annual interest rate of 5 percent, it will grow to $105 by January 1 of the next year. Hence, at an annual 5 percent interest rate, the present value of $105 payable a year from today is $100. Patient Protection and Affordable Care Act (PPACA) — A federal statute as the result of the healthcare reform. Signed into law on 3/23/10, the PPACA aims to expand Medicaid eligibility, incentivize businesses to provide health care benefits, prohibit denial of coverage/claims based on pre-existing conditions, establish health insurance exchanges, and support for medical research. The costs of these provisions are offset by a variety of taxes, fees, and cost- saving measures, such as new Medicare taxes for high-income brackets, taxes on indoor tanning, improved fairness in the Medicare Advantage program relative to traditional Medicare, and fees on medical devices and pharmaceutical companies. _) Ise) www.kpcb.com Productivity - Average real output per unit of input. Labor productivity is average real output per hour of labor. The growth of labor productivity is defined as the growth of real output that is not explained by the growth of labor input alone. Total factor productivity is average real output per unit of combined labor and capital services. The growth of total factor productivity is defined as the growth of real output that is not explained by the growth of labor and capital. Labor productivity and total factor productivity differ in that increases in capital per worker raise labor productivity but not total factor productivity. Tax Expenditures - Losses to the U.S. treasury from granting certain deductions, exemptions, or credits to specific categories of taxpayers. Tax breaks are one method Congress uses to promote certain policy objectives. For example, deductions for mortgages encourage home ownership, while credits for childcare expenses allow single parents to work. Tax expenditures are an alternative to direct government spending on policy programs. Troubled Asset Relief Program (TARP) - A program that permits the Secretary of the Treasury to purchase or insure troubled financial assets. Authority for the program was initially set by the Emergency Economic Stabilization Act of 2008 at $700 billion in assets outstanding at any one time and remains in effect until October 3, 2010. The TARP’s activities have included the purchase of preferred stock from financial institutions, support to automakers and related businesses, a program to avert housing foreclosures, and partnerships with the private sector. USA Inc. xxiv HOUSE_OVERSIGHT_021081
Page 259 - HOUSE_OVERSIGHT_021082
Trust Funds - In the federal accounting structure, accounts designated by law as trust funds (regardless of any other meaning of that term). Trust funds record the revenues, offsetting receipts, or offsetting collections earmarked for the purpose of the fund, as well as budget authority and outlays of the fund that are financed by those revenues or receipts. The federal government has more than 200 trust funds. The largest and best known finance major benefit programs (including Social Security and Medicare) and infrastructure spending (such as the Highway Trust Fund and the Airport and Airway Trust Fund). KP (@)2) www.kpcb.com USA Inc. xxv HOUSE_OVERSIGHT_021082
Page 260 - HOUSE_OVERSIGHT_021083
Xxvi HOUSE_OVERSIGHT_021083
Sponsored
Page 261 - HOUSE_OVERSIGHT_021084
Accounting, Government, 31 ARRA, 200-203 Balance Sheet, 209-217 Budgeting, Government, 32 Business Lines, 38-43 CBO (Congressional Budget Office) Entitlement Spending, 77 Forecasts, 11 Healthcare, 313 Long Term Outlook, 174, 175, 270 Policy Options, 262-264, 324-326 Tort Reform Proposals, 313, 314 Cash Flow, 14, 15, 26, 27, 33 Competitiveness, 390-394 Consequences of Inaction, 413-434 Austerity Measures, 426 Credit Rating, 419 Credit / Debt Crisis, 422-430 Deficits / Swap Rate Correlation, 430 Public Debt, Net Worth vs. Peers, 416-417 Short Term / Long Term, 415 Social Unrest, CDS, 429 Costs & Headcount, 345-348 Debt Composition, 168-172 Crisis, 422-447 Level, 145-160, 247 Defense Spending, 38-41, 63-70 by % GDP, 65, 68 by Country, Rank 67 by Number of Troops, 69, 70 by Type, 64 www.kpcb.com Deficit 35, 36, 54, 56 Deficit Commission, 256, 265, 326-328, 352, 353, 410, 465 Disability Insurance, 39 Economist vs. Investor Language, 36 Education, 377-382 Employment, 383-388 Entitlement + Interest vs. Revenue, 174, 175 Entitlement Covered Population, 86 Expanded Eligibility, 87 History, 74, 75 Income per Beneficiary, 89 Income vs Personal Savings, 90 Inflation Indexed, 250 Not Contracts, 251 Programs, 15, 17, 37, 43 Social Security % of income, 92 Spending, 72-82 Spending, "Unfunded", 82, 83 Spending Breakdown, 80, 81 Spending Deficit, 75 Spending per Household, 74 Trust Funds, 76, 77 Unfunded, 247 Fannie Mae / Freddie Mac, 182-187, 194-199 Federal Wages & Benefits, 335-337 Financial Challenges, 20, 21, 37, 49 GDP, 44, 356-368, 392, 405, 408 General Motors, 431-434 Growth, Sustainable Economic, 356-368 USA Inc. xxvii HOUSE_OVERSIGHT_021084
Page 262 - HOUSE_OVERSIGHT_021085
Headcount, 346-348 Healthcare, 16, 39 Costs 118-120, 279 Indicators, 112, 307 Performance, Life Expectancy, 111 Reform (PPACA), 114-120 Spend, 105-120 Spend vs. OECD countries, 108-112 Spend by funding source, 106 Spend per capita vs. OECD countries, 109 Spend vs. Education, 105 Income Statement, 54, 54-60 India GDP, 44 Infrastructure, 373-376 Interest Rates, 161-167 Medicaid, 16, 95-99, 280-328 Enrollment, Payments Up, 97 Underfunded, 96 State Budgets, 99 Medicare, 16, 43, 101-107, 280-328 Enrollment, Payments Up, 103 Medicare, Medicaid Beneficiaries, 86 Medicare, Medicaid per Beneficiary, 85 Medicare, Medicaid Underfunded, 84 Underfunded, 102 Medicare & Medicaid Restructure, 280-328 CBO Policy Options, 323-325 Deficit Commission Options, 326-328 Economic Factors, 292-310 Growing and Aging Population, 283-286 Improve Efficiency / Productivity, 315-318 Legal Factors, 311-314 Possible Solutions, 290, 291 Reduce Services, Medicaid, 319-322 Social Forces, 282-328 Unhealthy Lifestyles, 287-279 www.kpcb.com National Commission on Fiscal Responsibility and Reform, see Deficit Commission Net Debt/EBITDA, 34 Net Income, 54 Net Interest Payments, 17 Net Margin, 15, 54, 56 Net Worth, 27, 30 Non-Core 'Business' Out-Sourcing, 350-351 Off Balance Sheet Liabilities, 14, 212, 438 One Time Charges, 177-205 Operating Loss, 35 Out-Sourcing, 350-351 Pensions, 339-341 P&L, 56, 58 Real Estate, 182-187 Retirement, 42, 257 Social Security, 16, 130-141, 255-267 Solutions, 21 Summary, 13-23, 437-449 Surplus, 54, 56 TARP, 188-192 Tax Policies, 395-410 Tax Rates, 396-399 Tax Subsidies / Expenditures / Broaden Base, 401-410 Technology, 369-372 Tech / Infrastructure / Education, 366-382 USA Inc. xxviii HOUSE_OVERSIGHT_021085
Page 263 - HOUSE_OVERSIGHT_021086
Turnaround, 18, 19, 221-410 Unemployment Competitiveness, 390-394 Benefits, 122-128 Constraints, 235 Insurance, 16 Costs & Headcount, 345-348 Rates, 267, 346 Drive Sustainable Growth 355-365 Unions, 342-344 Expense Drivers, 231, 232 USA Inc. Data Points, 47 Expense Growth, 229, 230 Expenses, 252-353 Federal Wages & Benefits, 325-337 Imperatives, 234 USA Inc .Trends, 48 Wages, 336-337 Increase Employment, 383-388 War in Iraq, Afghanistan, Terror, 66 Invest in Education, 377-382 Invest in Infrastructure, 373-376 Invest in Technology, 366-372 Invest in Tech / Infrastructure / Education, 366- 382 Japan Experience, 246 Non-Core ‘Business’ Out-Sourcing, 350-351 Operating Efficiency, 329-353 Pensions, 338-34 1 Principles, 244 Questions, 240-243 Reform Entitlements, 253-328 Restructure Medicare & Medicaid, 268-328 Restructure Social Security, 255-267 Revenue Drivers, 227, 228 Revenue Expense Correlation, 222 Revenue Growth, 225, 226 Sensitive, 245 Tax Policies, 395-410 Tax Rates, 396-399 Tax Subsidies / Expenditures / Broaden Base, 401-410 Unions, 342-344 Weak Economy, 236 (@ 3) www.kpch.com USA Inc. xxix HOUSE_OVERSIGHT_021086
Sponsored
Page 264 - HOUSE_OVERSIGHT_021087
HOUSE_OVERSIGHT_021087
Page 265 - HOUSE_OVERSIGHT_021088
HOUSE_OVERSIGHT_021088
Page 266 - HOUSE_OVERSIGHT_021089
ISBN 978-1-4507-6450-6 CB www.kpcb.com USA Inc. — A Basic Summary of America’s Financial Statements HOUSE_OVERSIGHT_021089
Entities Mentioned
AB
A Ba
PERSON
Name reference in documents
AL
Altshuler
PERSON
Russian scientist
AM
Arnaud Mares
PERSON
Name reference in documents

Barack Obama
PERSON • 2 mentions
President of the United States from 2009 to 2017
Carmen Reinhart
PERSON
American economist
Dale W. Jorgenson
PERSON
American economist
DP
Data Points
PERSON
Name reference in documents

DataStream
PERSON
Surname reference in documents

David Cameron
PERSON
British politician (born 1966)
DP
Donald Pease
PERSON
Name reference in documents

Donald Trump
PERSON
President of the United States (2017–2021, 2025–present)
FB
Falling Behind
PERSON
Name reference in documents

Gem BT
PERSON
Name reference in documents

George W. Bush
PERSON
President of the United States from 2001 to 2009

Ghislaine Maxwell
PERSON
British socialite and sex trafficker, daughter of Robert Maxwell, accomplice of Jeffrey Epstein
GP
Giovanni Peri
PERSON
Economist (University of California-Davis)
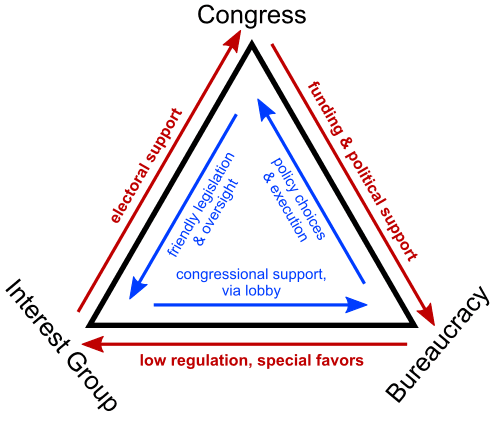
Gordon Adams
PERSON
Name reference in documents

Hae Nee
PERSON
Name reference in documents

James R. Horney
PERSON
Colombian association football player

John Chambers
PERSON
American businessman

Kenneth Rogoff
PERSON
Economist and chess player

Kevin J. Stiroh
PERSON
Economist (Federal Reserve Bank of New York)
LS
Losing Share
PERSON
Name reference in documents

Mark Twain
PERSON
American humorist and author, referenced in Epstein contact documents

Mary Meeker
PERSON
American venture capitalist and securities analyst
ME
mer = cee er mi eee
PERSON
Name reference in documents
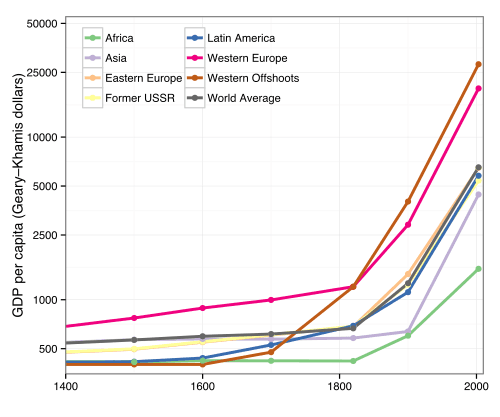
Mun S. Ho
PERSON
Ph.D. Harvard University 1989

Paul Otellini
PERSON
Former president & CEO of Intel (1950–2017)
PE
Pease
PERSON
Surname reference in Epstein documents
PC
Pierre Cailleteau
PERSON
Managing Director, Lazard, France

Reinhart
PERSON
Refers to Bruce Reinhart, former federal prosecutor who became Palm Beach County judge in Epstein case

rere Sie
PERSON
Name reference in documents
RC
Rg we ce
PERSON
Name reference in documents

Richard Berner
PERSON
Name reference in documents

Rogoff
PERSON
Surname or name fragment in documents
Sarah Carlson
PERSON
(born 1967)
SS
SE SE
PERSON
Name reference in documents
SS
Smo Se
PERSON
Name reference in documents
SU
Summar
PERSON
NER artifact - OCR error or non-person text
TO
TT oT oT oT
PERSON
Name reference in documents
WC
wes - eee ces ce eo ome cof oss cegI
PERSON
Name reference in documents
‘Social Benefits’
ORGANIZATION
Organization referenced in documents
Airway Trust Fund
ORGANIZATION
Organization referenced in documents
all USA Inc.’s
ORGANIZATION
Organization referenced in documents
Altshuler, Lim
ORGANIZATION
Organization referenced in documents
American Recovery and Reinvestment
ORGANIZATION
Organization referenced in documents
American Society of Civil
ORGANIZATION
Organization referenced in documents
American Society of Civil Engineers’
ORGANIZATION
Organization referenced in documents
Around USA Inc.
ORGANIZATION
Organization referenced in documents
ARPANET / Internet
ORGANIZATION
Organization referenced in documents
B kpeb USA Inc.
ORGANIZATION
Organization referenced in documents
Balance USA Inc.'s
ORGANIZATION
Organization referenced in documents
Better Than USA Worse
ORGANIZATION
Organization referenced in documents

Bloomberg L.P.
ORGANIZATION
American privately held financial, software, data, and media company
Bring USA Inc.
ORGANIZATION
Organization referenced in documents
BT TE BD TE
ORGANIZATION
Organization referenced in documents
Budget Options
ORGANIZATION
Organization referenced in documents
BUI Jem
ORGANIZATION
Organization referenced in documents

Bureau of Labor Statistics
ORGANIZATION
US government agency
Business Cycle - Fluctuations
ORGANIZATION
Organization referenced in documents
Business Intelligence Monitor
ORGANIZATION
Organization referenced in documents
Business Lines
ORGANIZATION
Organization referenced in documents
California Research Bureau
ORGANIZATION
Organization referenced in documents
CBO Policy Options
ORGANIZATION
Organization referenced in documents
Centers for Medicare & Medicaid Services
ORGANIZATION
Organization referenced in documents
Changing USA Inc.’s
ORGANIZATION
Organization referenced in documents
Citizens Receiving Government
ORGANIZATION
Organization referenced in documents
Collective Sacrifice and Hard Work
ORGANIZATION
Organization referenced in documents
Correlation Between 1986 & 2009
ORGANIZATION
Organization referenced in documents
Country
ORGANIZATION
Genre of American popular music
Credit / Debt Crisis
ORGANIZATION
Organization referenced in documents
Credit Rating Agencies
ORGANIZATION
Organization referenced in documents
Debt Level
ORGANIZATION
Organization referenced in documents
Declining Productivity +
ORGANIZATION
Organization referenced in documents
Dept. of
ORGANIZATION
Organization referenced in documents

Development
ORGANIZATION
Scientific journal
Drilldown on USA Inc. Financials
ORGANIZATION
Organization referenced in documents
Drinking Water
ORGANIZATION
Organization referenced in documents
e Congressional Budget Office
ORGANIZATION
Organization referenced in documents
e Unemployment Insurance and
ORGANIZATION
Organization referenced in documents
Education Spending
ORGANIZATION
Organization referenced in documents
ESGRP
ORGANIZATION
Organization referenced in documents
EU & IMF
ORGANIZATION
Organization referenced in documents

European Commission
ORGANIZATION
European Commission

European Union
ORGANIZATION
Political and economic union of 27 European states

Eurostat
ORGANIZATION
Statistics agency of the European Union

FactSet
ORGANIZATION • 2 mentions
American financial data company
Fannie Mae / Freddie Mac
ORGANIZATION
Organization referenced in documents
Federal Disability Insurance Trust Funds
ORGANIZATION
Organization referenced in documents
Federal Employees Health Benefits Plan
ORGANIZATION
Organization referenced in documents
Federal Medicaid
ORGANIZATION
Organization referenced in documents

Federal Reserve
ORGANIZATION
Federal Reserve System, central banking system of the United States
Federal Revenue & Expenses
ORGANIZATION
Organization referenced in documents
Federal Wages & Benefits
ORGANIZATION
Organization referenced in documents
Federal) Investment in Infrastructure
ORGANIZATION
Organization referenced in documents
FEHBP
ORGANIZATION
Organization referenced in documents
Fetimatad Lesees
ORGANIZATION
Organization referenced in documents
Financial Crisis
ORGANIZATION
Organization referenced in documents
Fiscal Commission
ORGANIZATION
Organization referenced in documents
Fiscal Crisis
ORGANIZATION
Organization referenced in documents
Fiscal Responsibility
ORGANIZATION
Organization referenced in documents
Fiscal Responsibility and Reform
ORGANIZATION
Organization referenced in documents
Focus on Productivity & Employment Growth
ORGANIZATION
Organization referenced in documents
Focus on Public Debt Levels
ORGANIZATION
Organization referenced in documents
Focus on Revenue
ORGANIZATION
Organization referenced in documents

Freddie Mac
ORGANIZATION
American government-sponsored enterprise
Funding Source
ORGANIZATION
Organization referenced in documents
GDP Growth & Job Creation
ORGANIZATION
Organization referenced in documents

General Motors
ORGANIZATION
American multinational automotive company
Global Foreign Exchange Reserves
ORGANIZATION
Organization referenced in documents
GM & USA
ORGANIZATION
Organization referenced in documents
Government-Sponsored Enterprise
ORGANIZATION
Organization referenced in documents

Haver Analytics
ORGANIZATION
Ice hockey statistics
Health & Human Services
ORGANIZATION
Organization referenced in documents
Health Insurance Program
ORGANIZATION
Organization referenced in documents
Health Maintenance Organization
ORGANIZATION
Organization referenced in documents
healthcare & infrastructure
ORGANIZATION
Organization referenced in documents
Heritage Foundation
ORGANIZATION
Organization referenced in documents
History News Network
ORGANIZATION
Organization referenced in documents
Household and Government Savings
ORGANIZATION
Organization referenced in documents
Housing + Healthcare Spending
ORGANIZATION
Organization referenced in documents
HOY EDOTATYH DAH BATS te P¥X
ORGANIZATION
Organization referenced in documents
Hs Ss
ORGANIZATION
Organization referenced in documents
Immigrants Equal
ORGANIZATION
Organization referenced in documents
Increasingly Allocated Resources Away
ORGANIZATION
Organization referenced in documents
Independent Payment Advisory Board
ORGANIZATION
Organization referenced in documents
Input and Output Materials
ORGANIZATION
Organization referenced in documents
International Bond
ORGANIZATION
Organization referenced in documents
Intra-Governmental Holdings
ORGANIZATION
Organization referenced in documents
K p Sources
ORGANIZATION
Organization referenced in documents
Kleiner Perkins Caufield & Byers
ORGANIZATION
Organization referenced in documents
KP Employment
ORGANIZATION
Organization referenced in documents
KP Mae / Freddie Mac
ORGANIZATION
Organization referenced in documents
KP McKinsey & Company
ORGANIZATION
Organization referenced in documents
KP Responsible Federal Budget
ORGANIZATION
Organization referenced in documents
KP Technology
ORGANIZATION
Organization referenced in documents
KP USA
ORGANIZATION
Organization referenced in documents

Labor Force
ORGANIZATION
Organization referenced in documents
Labor Productivity Growth
ORGANIZATION
Organization referenced in documents
Leaner and
ORGANIZATION
Organization referenced in documents
Leveraged Construction /
ORGANIZATION
Organization referenced in documents
Longer Term
ORGANIZATION
Organization referenced in documents
Losing Competitiveness
ORGANIZATION
Organization referenced in documents
Manpower Research
ORGANIZATION
Organization referenced in documents
Margin
ORGANIZATION
Organization referenced in documents

Markit
ORGANIZATION
Former UK business merged with IHS Inc. to IHS Markit which is now part of S&P Global
Math / Science
ORGANIZATION
Organization referenced in documents
Mathematics / Science
ORGANIZATION
Organization referenced in documents

McKinsey
ORGANIZATION • 2 mentions
Organization referenced in documents
Meaner National Defense
ORGANIZATION
Organization referenced in documents

Medicaid
ORGANIZATION
United States social health care program for families and individuals with limited resources
Medicaid Beneficiaries
ORGANIZATION
Organization referenced in documents
Medicare & Medicaid Restructure
ORGANIZATION
Organization referenced in documents
Mer Reduce Subsidies / Tax
ORGANIZATION
Organization referenced in documents
Metis ce en eee Isolate
ORGANIZATION
Organization referenced in documents

Moody’s
ORGANIZATION
English brand for sailing yachts
National Data
ORGANIZATION
Organization referenced in documents
National Savings (Personal + Corporate + Government Savings
ORGANIZATION
Organization referenced in documents

National Science Foundation
ORGANIZATION
Organization referenced in documents
Net Interest Expense
ORGANIZATION
Organization referenced in documents

Nintendo
ORGANIZATION
Japanese multinational video game and consumer electronics company
nment Tax
ORGANIZATION
Organization referenced in documents
Non-Core 'Business' Out-Sourcing
ORGANIZATION
Organization referenced in documents
Noococe fc ee HC
ORGANIZATION
Organization referenced in documents
Observations About America
ORGANIZATION
Organization referenced in documents
OECD Average
ORGANIZATION
Organization referenced in documents
OECD Tax Database
ORGANIZATION
Organization referenced in documents
Off-Balance Sheet Liabilities
ORGANIZATION
Organization referenced in documents

Office of Management and Budget
ORGANIZATION
Agency that prepares and evaluates the President of the United States' annual budget to Congress
Onahwonhd
ORGANIZATION
Organization referenced in documents
OPEB &
ORGANIZATION
Organization referenced in documents
Organization for Economic Co-operation
ORGANIZATION
Organization referenced in documents
Overall USA Infrastructure
ORGANIZATION
Organization referenced in documents
Perspective, USA Inc.'s
ORGANIZATION
Organization referenced in documents
Peter G. Peterson
ORGANIZATION
Organization referenced in documents

Pew Research Center
ORGANIZATION
Think tank based in Washington, D.C., US
Political Economy Research Institute
ORGANIZATION
Organization referenced in documents
Post-Employment Benefits
ORGANIZATION
Organization referenced in documents
Potential Policy Solutions
ORGANIZATION
Organization referenced in documents
Prefer USA Inc.’s
ORGANIZATION
Organization referenced in documents
Productivity and Growth’
ORGANIZATION
Organization referenced in documents
Program for International Student Assessment
ORGANIZATION
Organization referenced in documents
Public Investment
ORGANIZATION
Organization referenced in documents

Public Works
ORGANIZATION
Organization referenced in documents
Rank Challenge
ORGANIZATION
Organization referenced in documents
Resources Allocated to Housing + Healthcare
ORGANIZATION
Organization referenced in documents

Safra Catz
ORGANIZATION
Organization referenced in documents
Science and Engineering Indicators
ORGANIZATION
Organization referenced in documents
Secondary Education
ORGANIZATION
Organization referenced in documents
Seeking Revenue
ORGANIZATION
Organization referenced in documents
seme cor MennseY COSA Ine.
ORGANIZATION
Organization referenced in documents
Share of Global GDP
ORGANIZATION
Organization referenced in documents
Si The Urban Institute
ORGANIZATION
Organization referenced in documents
Social 5
ORGANIZATION
Organization referenced in documents
Social Forces
ORGANIZATION
Organization referenced in documents
Social Security / Medicare
ORGANIZATION
Organization referenced in documents
Social Security & Medicare & Medicaid
ORGANIZATION
Organization referenced in documents
Social Security Disability Insurance
ORGANIZATION
Organization referenced in documents
Social Security's
ORGANIZATION
Organization referenced in documents
Social Unrest
ORGANIZATION
Organization referenced in documents
Survivors Insurance
ORGANIZATION
Organization referenced in documents
Tax Rate Increase USA Inc.
ORGANIZATION
Organization referenced in documents
Taxes on Consumption of Goods & Services Lowest
ORGANIZATION
Organization referenced in documents
Te ES eS RS
ORGANIZATION
Organization referenced in documents
Technology / Infrastructure / Education
ORGANIZATION
Organization referenced in documents
Terror
ORGANIZATION
Organization referenced in documents
the Alternative Minimum Tax
ORGANIZATION
Organization referenced in documents
the Economy & Reallocate Resources
ORGANIZATION
Organization referenced in documents
the Federal Hospital Insurance
ORGANIZATION
Organization referenced in documents
the Federal Old-Age
ORGANIZATION
Organization referenced in documents
the Federal Reserve System
ORGANIZATION
Federal Reserve System
the Good News
ORGANIZATION
Organization referenced in documents
the Highway Trust Fund
ORGANIZATION
Organization referenced in documents
the National Council on Public Works Improvements
ORGANIZATION
Organization referenced in documents
The Overseas Profits Elephant
ORGANIZATION
Organization referenced in documents
the Postal Service
ORGANIZATION
Organization referenced in documents
the State Children's
ORGANIZATION
Organization referenced in documents
the U.S. Government’
ORGANIZATION
Organization referenced in documents

the United States Government
ORGANIZATION
United States federal government
Time Charges
ORGANIZATION
Organization referenced in documents
Treasuries
ORGANIZATION
Organization referenced in documents
Treasury Dept
ORGANIZATION
Organization referenced in documents
u & savings
ORGANIZATION
Organization referenced in documents
u Current Federal Income Tax Rates
ORGANIZATION
Organization referenced in documents
Unbalanced Economy
ORGANIZATION
Organization referenced in documents
USA Austri 17
ORGANIZATION
Organization referenced in documents
USA Education
ORGANIZATION
Organization referenced in documents
USA Government
ORGANIZATION
Organization referenced in documents
USA Inc. xxiv
ORGANIZATION
Organization referenced in documents
USA Inc.’s
ORGANIZATION
Organization referenced in documents
USA Ine
ORGANIZATION
Organization referenced in documents
USA Labor Force
ORGANIZATION
Organization referenced in documents
USA Productivity
ORGANIZATION
Organization referenced in documents
USA Productivity & Income
ORGANIZATION
Organization referenced in documents
USA Ranking High in Country
ORGANIZATION
Organization referenced in documents
USA Technology Research & Development Spending
ORGANIZATION
Organization referenced in documents
USA Total Government Healthcare
ORGANIZATION
Organization referenced in documents
Worker / Employment
ORGANIZATION
Organization referenced in documents
Y Growth & Unemployment Rates
ORGANIZATION
Organization referenced in documents
Y/Y Growth
ORGANIZATION
Organization referenced in documents
Y/Y Total
ORGANIZATION
Organization referenced in documents
YIY OECD Total
ORGANIZATION
Organization referenced in documents
- wv
LOCATION
Location referenced in documents

Albania
LOCATION
Country in southeastern Europe

Algeria
LOCATION
Country in North Africa

Angola
LOCATION
Country on the west coast of Southern Africa

Athens
LOCATION
Capital and largest city of Greece

Belgium
LOCATION
Country in western Europe

Bolivia
LOCATION
Sovereign state in South America

Canada
LOCATION
Country in North America

Chile
LOCATION
Country in South America

Columbia University
LOCATION
Private Ivy League research university in New York City

Croatia
LOCATION
Country in Central Europe

Cyprus
LOCATION
Mediterranean island country in West Asia

Denmark
LOCATION
Country in Northern Europe and North America

Ecuador
LOCATION
Sovereign state in South America

Estonia
LOCATION
Country in Northern Europe

Ethiopia
LOCATION
Country in the Horn of Africa

Finland
LOCATION
Country in Northern Europe

Flint
LOCATION
Seat of Genesee County, Michigan, United States of America
Gabon
LOCATION
Country on the Atlantic coast of Central Africa

Ghana
LOCATION
Country in West Africa

Hungary
LOCATION
Country in Central Europe

Ireland
LOCATION

Ireland Germany
LOCATION
Country in Central Europe

Kazakhstan
LOCATION
Sovereign state in Eastern Europe and Central Asia

Kenya
LOCATION
Country in Eastern Africa

Latvia
LOCATION
Sovereign state in northeastern Europe

Liechtenstein
LOCATION
Country in Central Europe

Lithuania
LOCATION
Country in northeastern Europe

Luxembourg
LOCATION
Country in Western Europe

Macedonia
LOCATION
Country in southeastern Europe

Malawi
LOCATION
Sovereign state in Africa

Malaysia
LOCATION
Country in Southeast Asia

Michigan
LOCATION
State of the United States of America
Middle of Pack
LOCATION
Location referenced in documents

Morocco
LOCATION
Sovereign state in North Africa

Mozambique
LOCATION
Country in Southeastern Africa; the current form of Mozambique since 1975

N. America
LOCATION
Continent

Namibia
LOCATION
Country in Southern Africa

New York City
LOCATION
Most populous city in the United States

New Zealand
LOCATION
Island country in the southwest Pacific Ocean

Norway
LOCATION
Country in Northern Europe

Paraguay
LOCATION
Sovereign state in South America

Romania
LOCATION
Country in Southeast Europe

Senegal
LOCATION
Country on the coast of West Africa

Slovakia
LOCATION
Country in Central Europe

Slovenia
LOCATION
Country in Central Europe

Sudan
LOCATION
Country in Northeast Africa

Tanzania
LOCATION
Country in East Africa

Tunisia
LOCATION
Country in North Africa

Uganda
LOCATION
Country in east Africa

United States
LOCATION
Country located primarily in North America

Uruguay
LOCATION
Sovereign state in South America
USA ireland
LOCATION
Location referenced in documents

Venezuela
LOCATION
Country in South America

Zambia
LOCATION
Country at the crossroads of Central and Southern Africa

Zimbabwe
LOCATION
Sovereign state in southern Africa
Statistics
Pages:66
Entities:298
Avg. OCR:88.8%
Sponsored