HOUSE_OVERSIGHT_020824_sub_001 - HOUSE_OVERSIGHT_020923
Document Information
Bates Range
HOUSE_OVERSIGHT_020824_sub_001 - HOUSE_OVERSIGHT_020923
Pages
100
Source
House Oversight Committee
Original Filename
USA_Inc.pdf
Document Content
Page 1 - HOUSE_OVERSIGHT_020824
No text available for this page
Page 2 - HOUSE_OVERSIGHT_020825
About USA Inc. Created and Compiled by Mary Meeker February 2011 This report looks at the federal government as if it were a business, with the goal of informing the debate about our nation’s financial situation and outlook. In it, we examine USA Inc.’s income statement and balance sheet. We aim to interpret the underlying data and facts and illustrate patterns and trends in easy-to-understand ways. We analyze the drivers of federal revenue and the history of expense growth, and we examine basic scenarios for how America might move toward positive cash flow. Thanks go out to Liang Wu and Fred Miller and former Morgan Stanley colleagues whose contributions to this report were invaluable. In addition, Richard Ravitch, Emil Henry, Laura Tyson, Al Gore, Meg Whitman, John Cogan, Peter Orszag and Chris Liddell provided inspiration and insights as the report developed. It includes a 2-page foreword; a 12-page text summary; and 460 PowerPoint slides containing data-rich observations. There’s a lot of material — think of it as a book that happens to be a slide presentation. We hope the slides in particular provide relevant context for the debate about America’s financials. To kick-start the dialogue, we are making the entire slide portion of the report available as a single work for non-commercial distribution (but not for excerpting, or modifying or creating derivatives) under the Creative Commons license. The spirit of connectivity and sharing has become the essence of the Internet, and we encourage interested parties to use the slides to advance the discussion of America’s financial present and future. If you would like to add your own data-driven observations, contribute your insights, improve or clarify ours, please contact us to request permission and provide your suggestions. This document is only a starting point for discussion; the information in it will benefit greatly from your thoughtful input. This report is available online and on iPad at www.kpcb.com/usainc In addition, print copies are available at www.amazon.com CB www.kpcb.com USA Inc. _ ii HOUSE_OVERSIGHT_020825
Page 3 - HOUSE_OVERSIGHT_020826
Foreword George P. Shultz, Paul Volcker, Michael Bloomberg, Richard Ravitch and John Doerr February 2011 Our country is in deep financial trouble. Federal, state and local governments are deep in debt yet continue to spend beyond their means, seemingly unable to stop. Our current path is simply unsustainable. What to do? A lot of people have offered suggestions and proposed solutions. Few follow the four key guideposts to success that we see for setting our country back on the right path: 1) create a deep and widely held perception of the reality of the problem and the stakes involved; 2) reassure citizens that there are practical solutions; 3) develop support in key constituencies; and 4) determine the right timing to deliver the solutions. USA Inc. uses each of these guideposts, and more; it is full of ideas that can help us build a better future for our children and our country. First, Mary Meeker and her co-contributors describe America’s problems in an imaginative way that should allow anyone to grasp them both intellectually and emotionally. By imagining the federal government as a company, they provide a simple framework for understanding our current situation. They show how deficits are piling up on our income statement as spending outstrips income and how our liabilities far exceed nominal assets on our balance sheet. USA Inc. also considers additional assets — hard to value physical assets and our intangible wealth — our creativity and energy and our tradition of an open, competitive society. Additionally, the report considers important trends, pointing specifically to an intolerable failure to educate many in the K-12 grades, despite our knowledge of how to do so. And all these important emotional arguments help drive a gut reaction to add to data provided to reinforce the intellectual reasons we already have. Second, USA Inc. provides a productive way to think about solving our challenges. Once we have created an emotional and intellectual connection to the problem, we want people to act and drive the solution, not to throw up their hands in frustration. The authors’ ingenious indirect approach is to ask what a turnaround expert would do and what questions he or she would ask. The report describes how we first stumbled into this mess, by failing to predict the magnitude of program costs, by creating perverse incentives for excessive behavior, and by missing important trends. By pointing to the impact of individual responsibility, USA /nc. gives us reason to believe that a practical solution exists and can be realized. CB www.kpcb.com USA Inc. @ iii HOUSE_OVERSIGHT_020826
Sponsored
Page 4 - HOUSE_OVERSIGHT_020827
Third, the report highlights how powerful bipartisan constituencies have emerged in the past to tackle great issues for the betterment of our nation, including tax reform, civil liberties, healthcare, education and national defense. Just as presidents of both parties rose to the occasion to preside over the difficult process of containment during the half-century cold war, we know we can still find leaders who are willing to step up and overcome political or philosophical differences for a good cause, even in these difficult times. Finally, the report makes an important contribution to the question of timing. Momentum will follow once the process begins to gain support, and USA Inc. should help by stimulating broad recognition and understanding of the challenges, by providing ways to think about solutions, and by helping constituencies of action to emerge. As the old saying goes, “If not now, when? If not us, who?” With this pioneering report, we have a refreshing, business-minded approach to understanding and addressing our nation’s future. Read on...you may be surprised by how much you learn. We hope you will be motivated to help solve the problem! CB www.kpcb.com USA Inc. — iv HOUSE_OVERSIGHT_020827
Page 5 - HOUSE_OVERSIGHT_020828
Table of Contents About USA ING. ee ii Foreword Ce ee ee ee ee ee eee ee ee ee ee ee ee ee iii Summary Ce 2 ee ee ee ee ee ee eee eee ee ee eee ee ee ee ee ee ee Vii Introduction Pe ee ee ee ee ee ee ee ee ee ee ee ee 5 High-Level Thoughts on Income Statement/Balance Sheet -------:-::-: 25 Income Statement Drilldown ee 53 Entitlement Spending Pe ee 72 Medicaid « - 0 tt tte 94 Medicare « * 0 tt ttt ee 100 Unemployment Benefits Pe ee 121 Social Security Se ee 129 Rising Debt Level and Interest Payments +--+ - sss tt ttt tt tts 142 Debt Level Se 145 Effective Interest Rates Pe ee 161 Debt Composition Pe ee er 168 Periodic Large One-Time Charges +++ +s ttt ttt ttt tt ts 177 TARP = ft tt 188 Fannie Mae/ Freddie Mac =: * : tt tt tt tt ee ee 193 ARRA 2 ot ttt 200 Balance Sheet Drilldown += - st tt ttt 209 CB www.kpcb.com USA Inc. Vv HOUSE_OVERSIGHT_020828
Page 6 - HOUSE_OVERSIGHT_020829
What Might a Turnaround Expert Consider?: ----s- sess sees eee 221 High-Level Thoughts on How to Turn Around USA Inc.’s Financial Outlook - --- 237 Focus onExpenses - ++ ttt ttt ee 953 Reform Entitlement Programs «++ ss ttt ttt tt tt te 255 Restructure Social Security - + - tt ttt ttt es 256 Restructure Medicare & Medicaid --- +--+ +--+ rrr eter eee 268 Focus on Operating Efficiency - + ss ttt ttt tt tt ee 329 Review Wages & Benefits ---- str es 335 Review Government Pension Plans -- +--+ +++ + +r rrr tree 338 Review Role of Unions ---: +: ct ttt ttt ee 342 Review Cost Structure & Headcount ---- +++ etree 345 Review Non-Core 'Business' for Out-Sourcing ----- +--+ rrr 349 Focus on Revenues «+++ ttt ee 355 Drive Sustainable Economic Growth -- +--+ tr rt ttt ee 356 Invest in Technology / Infrastructure / Education --- +s sss: 366 Increase /Improve Employment ---- +s sett t ttre 383 Improve Competitiveness -- +s ttt ttt ttt es 389 Consider Changing Tax Policies «+++ ttt tt tt tt tt ee 395 Review TaxRateS -- ttt e e 396 Reduce Subsidies / Tax Expenditures /Broaden Tax Base -:-::::: 400 Consequences of Inaction: ------ ett ttt 413 Short-Term, Long-Term «st ttt ttt ee 415 Public Debt, Net Worth vs. Peers = st ttt tt ttt 416 Lessons Learned From Historical Debt Crisis - -- +--+ +++ eet etree 422 General Motors -- tt tt 431 Summary «ct ee 437 Appendix -- ss ttt 453 Glossary «tt ee xix Index + # @ #e eee we eee ew Ew ww ew ew ew ew ee ee Xxvii CB www.kpcb.com USA Inc. _ vi HOUSE_OVERSIGHT_020829
Sponsored
Page 7 - HOUSE_OVERSIGHT_020830
Summary Imagine for a moment that the United States government is a public corporation. Imagine that its management structure, fiscal performance, and budget are all up for review. Now imagine that you’re a shareholder in USA Inc. How do you feel about your investment? Because 45% of us own shares in publicly traded companies, nearly half the country expects quarterly updates on our investments. But although 100% of us are stakeholders in the United States, very few of us look closely at Washington’s financials. If we were long-term investors, how would we evaluate the federal government’s business model, strategic plans, and operating efficiency? How would we react to its earnings reports? Nearly two-thirds of all American households pay federal income taxes, but very few of us take the time to dig into the numbers of the entity that, on average, collects 13% of our annual gross income (not counting another 15- 30% for payroll and various state and local taxes). We believe it’s especially important to pay closer attention to one of our most important investments. As American citizens and taxpayers, we care about the future of our country. As investors, we’re in an on-going search for data and insights that will help us make more informed investment decisions. It’s easier to predict the future if one has a keen understanding of the past, but we found ourselves struggling to find good information about America’s financials. So we decided to assemble — in one place and in a user-friendly format — some of the best data about the world’s biggest “business.” We also provide some historical context for how USA Inc.’s financial model has evolved over decades. And, as investors, we look at trend lines which help us understand the patterns (and often future directions) of key financial drivers like revenue and expenses. The complexity of USA Inc.’s challenges is well Known, and our presentation is just a starting point; it’s far from perfect or complete. But we are convinced that citizens — and investors — should understand the business of their government. Thomas Jefferson and Alexis de Tocqueville knew that — armed with the right information — the enlightened citizenry of America would make the right decisions. It is our humble hope that a transparent financial framework can help inform future debates. In the conviction that every citizen should understand the finances of USA Inc. and the plans of its “management team,” we examine USA Inc.’s income statement and balance sheet and present them in a basic, easy-to-use format. We summarize our thoughts in PowerPoint form and in this brief text summary at www.kpcb.com/usainc. We encourage people to take our data and thoughts and study them, critique them, augment them, share them, and make them better. There’s a lot of material — think of it as a book that happens to be a slide presentation. CB www.kpcb.com USA Inc. _ vii HOUSE_OVERSIGHT_020830
Page 8 - HOUSE_OVERSIGHT_020831
There are two caveats. First, we do not make policy recommendations. We try to help clarify some of the issues in a straightforward, analytical way. We aim to present data, trends, and facts about USA Inc.’s key revenue and expense drivers to provide context for how its financials have reached their present state. Our observations come from publicly available information, and we use the tools of basic financial analysis to interpret it. Forecasts generally come from 3rd-party agencies like the Congressional Budget Office (CBO), the nonpartisan federal agency charged with reviewing the financial impact of legislation. Second, the ‘devil is in the details.’ For US policy makers, the timing of material changes will be especially difficult, given the current economic environment. By the standards of any public corporation, USA Inc.’s financials are discouraging. True, USA Inc. has many fundamental strengths. On an operating basis (excluding Medicare and Medicaid spending and one-time charges), the federal government’s profit & loss statement is solid, with a 4% median net margin over the last 15 years. But cash flow is deep in the red (by almost $1.3 trillion last year, or -$11,000 per household), and USA Inc.’s net worth is negative and deteriorating. That net worth figure includes the present value of unfunded entitlement liabilities but not hard-to-value assets such as natural resources, the power to tax or mint currency, or what Treasury calls “heritage” or “stewardship assets” like national parks. Nevertheless, the trends are clear, and critical warning signs are evident in nearly every data point we examine. F2010 Cash Flow = -$1.3 Trillion; Net Worth = -$44 Trillion With a Negative Trend Line Over Past 15 Years USA Inc. Annual Cash Flow & Year-End Net Worth, F1996 — F2010 GOOD nnn ee eee eee cece reece eet ce cece ence nentete eae cneeceenacaeaeaneatateneaneatateneaeeataseaeasenctatastaenseseacnseasnscesnaness $15,000 0 go = | a 1 $0 = _ =< 8 = 8 A TF GAOO Rape ee MB ~-- «-$15,000 - 2 £ xo} ° it = = = % 2 (OME CU) Bee eee ee ncaa, Cee a ~-- -$30,000 > 7 <4 2 mi One-Time Expenses* ul $1,200 mmm Cash Flow (left axis) SR -— f -$45,000 =—O= Net Worth (right axis) BA COD -$60,000 F1996 F1998 F2000 F2002 F2004 F2006 F2008 F2010 Note: USA federal fiscal year ends in September; Cash flow = total revenue — total spending on a cash basis; net worth includes unfunded future liabilities from Social Security and Medicare on an accrual basis over the next 75 years. *One-time expenses in F2008 include $14B payments to Freddie Mac; F2009 includes $2798 net TARP payouts, $97B payment to Fannie Mae & Freddie Mac and $40B stimulus spending on discretionary items; F2010E includes $26B net TARP income, $1378 stimulus spending and $41B payment to Fannie Mae & Freddie Mac. F2010 net worth improved dramatically owing to revised actuarial estimates for Medicare program resulted from the Healthcare reform legisiation. For mare definitions, see next slide. Source: cash flow per White ke House Office of Management and Budget; net worth per Dept. of Treasury, “2010 Financial Report of the U.S. Government.” hs www.kpcb.com USA Inc. | Summary CB www.kpcb.com USA Inc. _ viii HOUSE_OVERSIGHT_020831
Page 9 - HOUSE_OVERSIGHT_020832
Underfunded entitlements are among the most severe financial burdens USA Inc. faces. And because some of the most underfunded programs are intended to help the nation’s poorest, the electorate must understand the full dimensions of the challenges. Unfunded Entitlement (Medicare + Social Security) + Underfunded F2010 USA Inc. Revenues + Expenses At A Glance Entitlement Expenditures (Medicaid) = Among Largest Long-Term Liabilities on USA Inc.'s Balance Sheet F2010 F2010 USA Inc. Expenses = USA Balance Sheet Liabilities Composition, F2010 Revenues = $3.5T Entitlement Programs $2.2T Net Interest Payment Discretionary S496p One-Time Items Unfunded Medicaid* $152B Social "Wadicare. Other Security Medicare c ' $707B $35.3T ‘orporate ivi Income Tax Income Tax Non-Defense Unfunded $22.8T $191B % $8998 Discretionary 12% S431B deral Veteran Federal ‘ai ‘edera Employee zi Debt Other Benefits Benefits $1.6T $2.1T $3.7T $9.1T Social . Defense Medicare + Federal es Medicaid wssiraoe Tax ease 2 2 ) Unemployment Insurance + Other Entitlements $553B Social Security $7.9T Note: USA federal fiscal year ends in September; tinalividux defense discretionary induces federal spending on edi KP KP EE www kpcb. com USA Inc. | Summary 1H worn. kpc. com Some consider defense outlays — which have nearly doubled in the last decade, to 5% of GDP — a principal cause of USA Inc.’s financial dilemma. But defense spending is still below its 7% share of GDP from 1948 to 2000; it accounted for 20% of the budget in 2010, compared with 41% of all government spending between 1789 and 1930. The principal challenges lie elsewhere. Since the Great Depression, USA Inc. has steadily added “business lines” and, with the best of intentions, created various entitlement programs. They serve many of the nation’s poorest, whose struggles have been made worse by the recent financial crisis. Apart from Social Security and unemployment insurance, however, funding for these programs has been woefully inadequate — and getting worse. Entitlement expenses amount to $16,000 per household per year, and entitlement spending far outstrips funding, by more than $1 trillion (or $9,000 per household) in 2010. More than 35% of the US population receives entitlement dollars or is on the government payroll, up from ~20% in 1966. Given the high correlation of rising entitlement income with declining savings, do Americans feel less compelled to save if they depend on the government for their future savings? It is interesting to note that in China the household savings rate is ~36%, per our estimates based on CEIC data, in part due to a higher degree of self-reliance — and far fewer established pension plans. In the USA, the personal savings rate (defined as savings as percent of disposable income) was 6% in 2010 and only 3% from 2000 to 2008. CB www.kpcb.com USA Inc. ix HOUSE_OVERSIGHT_020832
Sponsored
Page 10 - HOUSE_OVERSIGHT_020833
Millions of Americans have come to rely on Medicare and Medicaid — and spending has skyrocketed, to 21% of USA Inc.’s total expenses (or $724B) in F2010, up from 5% forty years ago. Together, Medicaid and Medicare — the programs providing health insurance to low-income households and the elderly, respectively — now account for 35% of total healthcare spending in the USA. Since their creation in 1965, both programs have expanded markedly. Medicaid now serves 16% of all Americans, compared with 2% at its inception; Medicare now serves 15% of the population, up from 10% in 1966. As more Americans receive benefits and as healthcare costs continue to outstrip GDP growth, total spending for the two entitlement programs is accelerating. Over the last decade alone, Medicaid spending has doubled in real terms, with total program costs running at $273 billion in F2010. Over the last 43 years, real Medicare spending per beneficiary has risen 25 times, driving program costs well (10x) above original projections. In fact, Medicare spending exceeded related revenues by $272 billion last year. Amid the rancor about government’s role in healthcare spending, one fact is undeniable: government spending on healthcare now consumes 8.2% of GDP, compared with just 1.3% fifty years ago. Total Government* Healthcare Spending Increases are Staggering — Up 7x as % of GDP Over Five Decades vs. Education Spending Only Up 0.6x USA Total Government Healthcare vs. Education Spending as % of GDP, 1960 — 2009 erms 8% 65 enema neeinnumuoninenienison ng Al gece 6 gpa Ermer Spending as % of GDP ——Total Government (Federal + State + Local} Spending on Healthcare \ ’ ——Total Government (Federal + State + Local} Spending on Education Yo oot 1960 1964 1968 1972 1976 1980 1984 1988 1992 1996 2000 2004 2008 Note: “Total government spending on heaithcare includes Medicare, Medicaid and other programs such as federa/ employee and veteran health benefits, total government spending on education includes spending on pre-primary through KP tertiary education programs. Source: Dept. of Education, Dept. of Heaith & Human Services. EI www. kpcb.com USA Inc, | Summary The overall healthcare funding mix in the US is skewed toward private health insurance due to the predominance of employer-sponsored funding (which covers 157MM working Americans and their families, or 58% of the total population in 2008 vs. 64% in 1999). This mixed private-public funding scheme has resulted in implicit cross-subsidies, whereby healthcare providers push KP CB www.kpcb.com USA Inc. =X HOUSE_OVERSIGHT_020833
Page 11 - HOUSE_OVERSIGHT_020834
costs onto the private market to help subsidize lower payments from public programs. This tends to help drive a cycle of higher private market costs causing higher insurance premiums, leading to the slow erosion of private market coverage and a greater enrollment burden for government programs. The Patient Protection and Affordable Care Act, enacted in early 2010, includes the biggest changes to healthcare since 1965 and will eventually expand health insurance coverage by ~10%, to 32 million new lives. Increased access likely means higher spending if healthcare costs continue to grow 2 percentage points faster than per capita income (as they have over the past 40 years). The CBO sees a potential $143B reduction in the deficit over the next 10 years, but this assumes that growth in Medicare costs will slow — an assumption the CBO admits is highly uncertain. Unemployment Insurance and Social Security are adequately funded...for now. Their future, unfortunately, isn’t so clear. Unemployment Insurance is cyclical and, apart from the 2007-09 recession, generally operates with a surplus. Payroll taxes kept Social Security mainly at break-even until 1975-81 when expenses began to exceed revenue. Reforms that cut average benefits by 5%, raised tax rates by 2.3%, and increased the full retirement age by 3% (to 67) restored the system’s stability for the next 25 years, but the demographic outlook is poor for its pay-as-you-go funding structure. In 1950, 100 workers supported six beneficiaries; today, 100 workers support 33 beneficiaries. Since Social Security began in 1935, American life expectancy has risen 26% (to 78), but the “retirement age’ for full benefits has increased only 3%. Regardless of the emotional debate about entitlements, fiscal reality can’t be ignored — if these programs aren’t reformed, one way or another, USA Inc.’s balance sheet will go from bad to worse. Federal Government Spending Had Risen to 24% of GDP in 2010, Up From an Average of 3% From 1790 to 1930 Federal Government Spending as % of GDP, 1790 — 2010 ee sssceeeeeentennes 24% in 2010 eS aE 3% Trendline Average 15% - 1790-1930 Federal Spending as % of GDP saree UneeeeneenenneUeeeeeccecnecccncenn | REE VW tes eee OY 1790 1810 1830 1850 1870 1890 1910 1930 1950 1970 1990 2010 Source: Federal spending per Series Y 457-465 in "Historical Statistics of the United States, Colonial Times to 1970, Part il and per White House OMB. GDP prior to 1930 per Louis Johnston and Samuel H. Williamson, “What Was the U.S. GDP Then?" KP MeasuringWorth, 2010. GDP post 1930 per White House OMB. Neither federai spending nor GDP data are adjusted for inflation. (aE wew. kpcb.com USA Inc. | Summary KP CB www.kpcb.com USA Inc. xi HOUSE_OVERSIGHT_020834
Page 12 - HOUSE_OVERSIGHT_020835
Entitlement Spending Increased 11x While Real GDP Grew 3x Over Past 45 Years USA Real Federal Expenses, Entitlement Spending, Real GDP % Change, 1965 — 2010 OT ° Entitlement Expenses Total Expenses 1000% -- ~~ +10.6x Entitlement Programs — =Real GDP BOO sserresccsascsesnancsensaran-sansnansnnamneraat 0st SASEG SAIN ASSES E ROBERT ES SERIES EES EASES OPO gMMNSO Total ce _ Aien Expenses +3.3X % Change From 1965 CO ee Real GDP —_ —_ oo oe QV oot 1965 1969 1973 1977 1981 1985 1989 1993 1997 2001 2005 2009 iD Note: Data adjusted for inflation. Source: White House Office of Management and Budget. a PS sacs rpeo com USA Inc. | Summary Take a step back, and imagine what the founding fathers would think if they saw how our country’s finances have changed. From 1790 to 1930, government spending on average accounted for just 3% of American GDP. Today, government spending absorbs closer to 24% of GDP. It’s likely that they would be even more surprised by the debt we have taken on to pay for this expansion. As a percentage of GDP, the federal government’s public debt has doubled over the last 30 years, to 53% of GDP. This figure does not include claims on future resources from underfunded entitlements and potential liabilities from Fannie Mae and Freddie Mac, the Government Sponsored Enterprises (GSEs). If it did include these claims, gross federal debt accounted for 94% of GDP in 2010. The public debt to GDP ratio is likely to triple to 146% over the next 20 years, per CBO. The main reason is entitlement expense. Since 1970, these costs have grown 5.5 times faster than GDP, while revenues have lagged, especially corporate tax revenues. By 2037, cumulative deficits from Social Security could add another $11.6 trillion to the public debt. The problem gets worse. Even as USA Inc.’s debt has been rising for decades, plunging interest rates have kept the cost of supporting it relatively steady. Last year’s interest bill would have been 155% (or $290 billion) higher if rates had been at their 30-year average of 6% (vs. 2% in 2010). As debt levels rise and interest rates normalize, net interest payments could grow 20% or more annually. Below-average debt maturities in recent years have also kept the Treasury’s borrowing costs down, but this trend, too, will drive up interest payments once interest rates rise. CB www.kpcb.com USA Inc. — xii HOUSE_OVERSIGHT_020835
Sponsored
Page 13 - HOUSE_OVERSIGHT_020836
Can we afford to wait until the turning point comes? By 2025, entitlements plus net interest payments will absorb all — yes, all — of USA Inc.'s revenue, per CBO. Entitlement Spending + Interest Payments Alone Should Exceed USA Inc. Total Revenue by 2025E, per CBO Entitlement Spending + Interest Payments vs. Revenue as % of GDP, 1980 — 2050E a —— Revenue 30% . —o—Entitlement Spending + Net fo pr. Interest Payments 20% eager 10% — poo Total Revenue & Entitlement + Net Interest Payments as % of GDP 0% 1 1 T T T T T T 1980 1990 2000 2010E 2020E 2030E 2040E 2050E Source: Congressional Budget Office (CBO) Long-Term Budget Outlook (6/10). Note that entitlement spending includes federal government expenditures on Social Security, Medicare and Medicaid. Data in our chart is based on CBO’s ‘alternative fisca/ scenario’ forecast, which assumes a continuation of today’s underlying fiscal policy. Note that CBO aiso maintains an ‘extended-baseline’ scenario, which adheres closely to current law. The ailternative fiscal scenario deviates from CBO’s baseline because it incorporates some policy changes that are widely expected fo occur (such as extending the 2001-2003 tax cuts rather than letting them expire as scheduled by current law and adjusting physician payment rates to be in line with the Medicare economic index rather than at fower scheduled rates) and that policymakers have requiarly made in the past. www.kpcb.com USA Inc. | Summary Less than 15 years from now, in other words, USA Inc. — based on current forecasts for revenue and expenses - would have nothing left over to spend on defense, education, infrastructure, and R&D, which today account for only 32% of USA Inc. spending, down from 69% forty years ago. This critical juncture is getting ever closer. Just ten years ago, the CBO thought federal revenue would support entitlement spending and interest payments until 2060 — 35 years beyond its current projection. This dramatic forecast change over the past ten years helps illustrate, in our view, how important it is to focus on the here-and-now trend lines and take actions based on those trends. How would a turnaround expert determine ‘normal’ revenue and expenses? The first step would be to examine the main drivers of revenue and expenses. It’s not a pretty picture. While revenue — mainly taxes on individual and corporate income — is highly correlated (83%) with GDP growth, expenses — mostly entitlement spending — are less correlated (73%) with GDP. With that as backdrop, our turnaround expert might try to help management and shareholders (citizens) achieve a long-term balance by determining “normal” levels of revenue and expenses: CB www.kpcb.com USA Inc. xiii HOUSE_OVERSIGHT_020836
Page 14 - HOUSE_OVERSIGHT_020837
* From 1965 to 2005 (a period chosen to exclude abnormal trends related to the recent recession), annual revenue growth (3%) has been roughly in line with GDP growth, but corporate income taxes have grown 2% a year. Social insurance taxes grew 5% annually and represented 37% of USA Inc. revenue, compared with 19% in 1965. An expert might ask: o What level of social insurance or entitlement taxes can USA Inc. support without reducing job creation? o Are low corporate income taxes important to global competitive advantage and stimulating growth? * Entitlement spending has risen 5% a year on average since 1965, well above average annual GDP growth of 3%, and now absorbs 51% of all expenses, more than twice its share in 1965. Defense and non-defense discretionary spending (including infrastructure, education, and law enforcement) is up just 1-2% annually over that period. Questions for shareholders: o Do USA Inc.’s operations run at maximum efficiency? Where are the opportunities for cost savings? o Should all expense categories be benchmarked against GDP growth? Should some grow faster or slower than GDP? If so, what are the key determinants? o Would greater investment in infrastructure, education, and global competitiveness yield more long-term security for the elderly and disadvantaged? With expenses outstripping revenues by a large (and growing) margin, a turnaround expert would develop an analytical framework for readjusting USA Inc.’s business model and strategic plans. Prudence would dictate that our expert assume below-trend GDP growth and above-trend unemployment, plus rising interest rates — all of which would make the base case operating scenario fairly gloomy. This analysis can’t ignore our dependence on entitlements. Almost one-third of all Americans have grown up in an environment of lean savings and heavy reliance on government healthcare subsidies. It’s not just a question of numbers — it’s a question of our responsibilities as citizens...and what kind of society we want to be. Some 90 million Americans (out of a total population of 307 million) have grown accustomed to support from entitlement programs; so, too, have 14 million workers in the healthcare industry who, directly or indirectly, benefit from government subsidies via Medicare and Medicaid. Low personal savings and high unemployment make radical change difficult. Political will can be difficult to summon, especially during election campaigns. B GB www.kpcb.com USA Inc. xiv HOUSE_OVERSIGHT_020837
Page 15 - HOUSE_OVERSIGHT_020838
At the same time, however, these numbers don’t lie. With our demographics and our debts, we’re on a collision course with the future. The good news: Although time is growing short, we still have the capacity to create positive outcomes. Even though USA Inc. can print money and raise taxes, USA Inc. cannot sustain its financial imbalance indefinitely — especially as the Baby Boomer generation nears retirement age. Net debt levels are approaching warning levels, and some polls suggest that Americans consider reducing debt a national priority. Change is legally possible. Unlike underfunded pension liabilities that can bankrupt companies, USA Inc.’s underfunded liabilities are not legal contracts. Congress has the authority to change the level and conditions for Social Security and Medicare benefits; the federal government, together with the states, can also alter eligibility and benefit levels for Medicaid. Options for entitlement reform, operating efficiency, and stronger long-term GDP growth. As analysts, not public policy experts, we can offer mathematical illustrations as a framework for discussion (not necessarily as actual solutions). We also present policy options from third-party organizations such as the CBO. Reforming entitlement programs — Social Security. The underfunding could be addressed through some or all of the following mechanical changes: increasing the full retirement age to as high as 73 (from the current level of 67); and/or reducing average annual social security benefits by up to 12% (from $13,010 to $11,489); and/or increasing the social security tax rate from 12.4% to 14.2%. Options proposed by the CBO include similar measures, as well as adjustments to initial benefits and index levels. Of course, the low personal savings rates of average Americans — 3% of disposable income, compared with a 10% average from 1965 to 1985 — limit flexibility, at least in the early years of any reform. Reforming entitlement programs — Medicare and Medicaid. Mathematical illustrations for these programs, the most underfunded, seem draconian: Reducing average Medicare benefits by 53%, to $5,588 per year, or increasing the Medicare tax rate by 3.9 percentage points, to 6.8%, or some combination of these changes would address the underfunding of Medicare. As for Medicaid, the lack of a dedicated funding stream (i.e., a tax similar to the Medicare payroll tax) makes the math even more difficult. But by one measure from the Kaiser Family Foundation, 60% of the Medicaid budget in 2001 was spent on so-called optional recipients (such as mid- to low-income population above poverty level) or on optional services (such as dental services and prescription drug benefits). Reducing or controlling these benefits could help control Medicaid spending — but increase the burden on some poor and disabled groups. Ultimately, the primary issue facing the US healthcare system is ever-rising costs, historically driven by increases in price and utilization. Beneath sustained medical cost inflation is an entitlement mentality bolted onto a volume-based reimbursement scheme. All else being equal, the outcome is an incentive to spend: Underlying societal, financial, and liability factors combine to fuel an inefficient, expensive healthcare system. B GB www.kpcb.com USA Inc. Xv HOUSE_OVERSIGHT_020838
Sponsored
Page 16 - HOUSE_OVERSIGHT_020839
Improving operating efficiency. With nearly one government civilian worker (federal, state and local) for every six households, efficiency gains seem possible. A 20-year trend line of declining federal civilian headcount was reversed in the late 1990s. Resuming that trend would imply a 15% potential headcount reduction over five years and save nearly $300 billion over the next ten years. USA Inc. could also focus intensively on local private company outsourcing, where state and local governments are finding real productivity gains. Improving long-term GDP growth — productivity and employment. Fundamentally, federal revenues depend on GDP growth and related tax levies on consumers and businesses. Higher GDP growth won't be easy to achieve as households rebuild savings in the aftermath of a recession. To break even without changing expense levels or tax policies, USA Inc. would need real GDP growth of 6-7% in F2012-14 and 4-5% in F2015-20, according to our estimates based on CBO data — highly unlikely, given 40-year average GDP growth of 3%. While USA Inc. could temporarily increase government spending and investment to make up for lower private demand in the near term, the country needs policies that foster productivity and employment gains for sustainable long-term economic growth. How Much Would Real GDP Need to Grow to Drive USA Inc. to Break-Even Without Policy Changes? 6-7% in F2012E-F2014E & 4-5% in F2015- F2020E...Well Above 40-Year Average of 3% CBO’s Baseline Real GDP Growth vs. Required Real GDP Growth for a Balanced Budget Between F2011E and F2020E A% Real GDP Y/Y Growth (%) N sz 200: 2011E 2013E 2015E 2017E 2019E Real GDP Annual Growth (CBO Baseline Forecast) = Real GDP Annual Growth Needed to Eliminate Fiscal Deficit — -1970-2009 Average Real GDP Growth KP Source: CBO, “The Budget and Economic Outlook: Fiscal Years 2010 to 2020,” 8/10. §@S) www kpcb.com USA Inc. | Summary Productivity gains and increased employment each contributed roughly half of the long-term GDP growth between 1970 and 2009, per the National Bureau of Economic Research. Since the 1960s, as more resources have gone to entitlements and interest payments, USA Inc. has scaled back its investment in technology R&D and infrastructure as percentages of GDP. Competitors are making these investments. India plans to double infrastructure spending as a percent of GDP by 2013, and its tertiary (college) educated population will double over the next ten years, according to Morgan Stanley analysts, enabling its GDP growth to accelerate to 9- 10% annually by 2015 (China’s annual GDP growth is forecast to remain near 8% by 2015). USA Inc. can’t match India’s demographic advantage, but technology can help. KP CB www.kpcb.com USA Inc. xvi HOUSE_OVERSIGHT_020839
Page 17 - HOUSE_OVERSIGHT_020840
For employment gains, USA Inc. should minimize tax and regulatory uncertainties and encourage businesses to add workers. While hiring and R&D-related tax credits may add to near-term deficits, over time, they should drive job and GDP growth. Immigration reform could also help: A Federal Reserve study in 2010 shows that immigration does not take jobs from U.S.-born workers but boosts productivity and income per worker. Changing tax policies. Using another simple mechanical illustration, covering the 2010 budget deficit (excluding one- time charges) by taxes alone would mean doubling individual income tax rates across the board, to roughly 26-30% of gross income, we estimate. Such major tax increases would ultimately be self-defeating if they reduce private income and consumption. However, reducing tax expenditures and subsidies such as mortgage interest deductions would broaden the tax base and net up to $1.7 trillion in additional revenue over the next decade, per CBO. A tax based on consumption - like a value added tax (VAT) - could also redirect the economy toward savings and investment, though there would be drawbacks. These issues are undoubtedly complex, and difficult decisions must be made. But inaction may be the greatest risk of all. The time to act is now, and our first responsibility as investors in USA Inc. is to understand the task at hand. Our review finds serious challenges in USA Inc.’s financials. The ‘management team’ has created incentives to spend on healthcare, housing, and current consumption. At the margin, investing in productive capital, education, and technology — the very tools needed to compete in the global marketplace — has stagnated. America’s Resources Allocated to Housing + Healthcare Nearly Doubled as a Percent of GDP Since 1965, While Household and Government Savings Fell Dramatically Healthcare + Housing Spending vs. Net Household + Government Savings as % of GDP, 1965-2009 — Housing + Healthcare Spending as % of GDP —oO=Net Household + Government Savings as % of GDP As % of GDP 1970 1975 1980 1985 1990 1995 Note: Housing includes purchase, rent and home improvement. Government savings occur when government runs a surplus. Ta Source: BEA, CMS via Haver Analytics. < kpcb.com USA Inc. | Summary CB www.kpcb.com USA Inc. xvii HOUSE_OVERSIGHT_020840
Page 18 - HOUSE_OVERSIGHT_020841
With these trends, USA Inc. will not be immune to the sudden crises that have afflicted others with similar unfunded liabilities, leverage, and productivity trends. The sovereign credit issues in Europe suggest what might lie ahead for USA Inc. shareholders — and our children. In effect, USA Inc. is maxing out its credit card. It has fallen into a pattern of spending more than it earns and is issuing debt at nearly every turn. Common principles for overcoming this kind of burden include the following: 1) Acknowledge the problem — some 80% of Americans believe ‘dealing with our growing budget deficit and national debt’ is a national priority, according to a Peter G. Peterson Foundation survey in 11/09; 2) Examine past errors — People need clear descriptions and analysis to understand how the US arrived at its current financial condition — a ‘turnaround CEO’ would certainly initiate a ‘no holds barred’ analysis of the purpose, success and operating efficiency of all of USA Inc.’s spending; 3) | Make amends for past errors — Most Americans today at least acknowledge the problems at personal levels and say they rarely or never spend more than what they can afford (63% according to a 2007 Pew Research study). The average American knows the importance of managing a budget. Perhaps more would be willing to sacrifice for the greater good with an understandable plan to serve the country’s long-term best interests; 4) Develop a new code of behavior — Policymakers, businesses (including investment firms), and citizens need to share responsibility for past failures and develop a plan for future successes. Past generations of Americans have responded to major challenges with collective sacrifice and hard work. Will ours also rise to the occasion? CB www.kpcb.com USA Inc. xviii HOUSE_OVERSIGHT_020841
Sponsored
Page 19 - HOUSE_OVERSIGHT_020842
A —=} USA Inc. February 2011 USA Inc. — Outline Introduction High-Level Thoughts on Income Statement/Balance Sheet Income Statement Drilldown What Might a Turnaround Expert — Empowered to Improve USA Inc.’s Financials — Consider? Consequences of Inaction Summary Appendix KP (@E) www.kpcb.com USAInc. 2 HOUSE_OVERSIGHT_020842
Page 20 - HOUSE_OVERSIGHT_020843
This work is licensed for non-commercial distribution (but NOT for excerpting, or modifying or creating derivatives) under the Creative Commons Attribution-NonCommercial-NoDerivs 3.0 Unported CC BY-NC-ND license. You can find this license at http://creativecommons.org/licenses/by-nc- nd/3.0/legalcode or send a letter to Creative Commons, 171 Second Street, Suite 300, San Francisco, CA, 94105, USA. HOUSE_OVERSIGHT_020843
Page 21 - HOUSE_OVERSIGHT_020844
Introduction if Dp i USA Ince. | Introduction 5 About This Report CB www.kpcb.com USA Ine. | Introduction 6 HOUSE_OVERSIGHT_020844
Sponsored
Page 22 - HOUSE_OVERSIGHT_020845
Presentation Premise For America to remain the great country it has been for the past 235 years, it must determine the best ways to honor the government’s fundamental mission derived from the Constitution: ...to form a more perfect union, establish justice, insure domestic tranquility, provide for the common defense, promote the general welfare and secure the blessings of liberty to ourselves and our posterity. To this end, government should aim to help create a vibrant environment for economic growth and productive employment. It should manage its operations and programs as effectively and efficiently as possible, improve its financial position by driving the federal government's income statement to long-term break-even, and reduce the unsustainable level of debt on its balance sheet. KP i USA Inc. | Introduction 7 USA Inc. Concept Healthy financials and compelling growth prospects are key to success for businesses (and countries). So if the US federal government — which we call USA Inc. — were a business, how would public shareholders view it? How would long-term investors evaluate the federal government's business model, strategic plans, and operating efficiency? How would analysts react to its earnings reports? Although some 45%1 of American households own shares in publicly traded companies and receive related quarterly financial statements, not many “stakeholders” look closely at Washington’s financials. Nearly two-thirds of all American households? pay federal income taxes, but very few take the time to dig into the numbers of the entity that, on average, collects 13%? of all Americans’ annual gross income (not counting another 15-30% for payroll and various state and local taxes). We drill down on USA Inc.’s past, present, and (in some cases) future financial dynamics and focus on the country’s income statement and balance sheet and related trends. We isolate and review key expense and revenue drivers. On the expense side, we examine the major entitlement programs (Medicare, Medicaid and Social Security) as well as defense and other major discretionary programs. On the revenue side, we focus on GDP growth (driven by labor productivity and employment in the long run) and tax policies. We present basic numbers-driven scenarios for addressing USA Inc.'s financial challenges. In addition, we lay out the type of basic checklists that corporate turnaround experts might use as starting points when looking at some of USA Inc.’s business model challenges. Source: 1) 2008 ICI (Investment Company Institute) / SIFMA (Securities Industry and Financial Markets Association) Equity and Bond Owners Survey; 2) Number of tax returns with positive tax liability (91MM) divided by total number of returns filed (142MM), per Tax Foundation calculations based on IRS data; 3) Total federal income taxes (ex. payroll taxes) paid divided by total adjusted gross income, per IRS 2007 data. www.kpcb.com USA Inc. | Introduction 8 HOUSE_OVERSIGHT_020845
Page 23 - HOUSE_OVERSIGHT_020846
Why We Wrote This Report As American citizens / tax payers, we care about the future of our country. As investors, we search for data and insights to help us make better investment decisions. (It’s easier to predict the future with a keen understanding of the past.) We found ourselves searching for better information about the state of America’s financials, and we decided to assemble — in one place and in a user-friendly format — some of the best data about the world’s biggest “business.” In addition, we have attempted to provide some historical context for how USA Inc.’s financial model has evolved over decades. The complexity of USA Inc.’s challenges is well Known, and our presentation is just a starting point; it’s far from perfect or complete. But we are convinced that citizens — and investors — should understand the business of their government. Thomas Jefferson and Alexis de Tocqueville knew that — armed with the right information — the enlightened citizenry of America would make the right decisions. It is our humble hope that a transparent financial framework can help inform future debates. KP i USA Inc. | Introduction 9 What You'll Find Here... In the conviction that every citizen should understand the finances of USA Inc. and the plans of its “management team,” we examine USA Inc.’s income statement and balance sheet and present them in a basic, easy-to- use format. In this document, a broad group of people helped us drill into our federal government's basic financial metrics. We summarize our thoughts in PowerPoint form here and also have provided a brief text summary at www.kpcb.com/usainc. We encourage people to take our data and thoughts and study them, critique them, augment them, share them, and make them better. There’s a lot of material — think of it as a book that happens to be a slide presentation. KP a USA Inc. | Introduction 10 HOUSE_OVERSIGHT_020846
Page 24 - HOUSE_OVERSIGHT_020847
...And What You Won't We do not make policy recommendations. We try to help clarify some of the issues in a simple, analytically-based way. We aim to present data, trends, and facts about USA Inc.’s key revenue and expense drivers to provide context for how its financials have reached their present state. We did not base this analysis on proprietary data. Our observations come from publicly available information, and we use the tools of basic financial analysis to interpret it. Forecasts generally come from 3rd-party agencies like the Congressional Budget Office (CBO). For US policy makers, the timing of material changes will be especially difficult, given the current economic environment. No doubt, there will be compliments and criticism of things in the presentation (or missing from it). We hope that this report helps advance the discussion and we welcome others to opine with views (backed up by data). KP i USA Inc. | Introduction 11 We Focus on Federal, Not State & Local Government Data e Federal / State & Local Governments Share Different Responsibilities — Federal government is financially responsible for all or the majority of Defense, Social Security, Medicare and Interest Payments on federal debt and coordinates / shares funding for public investment in education / infrastructure. — State & local governments are financially responsible for all or the majority of Education, Transportation (Road Construction & Maintenance), Public Safety (Police / Fire Protection / Law Courts / Prisons) and Environment & Housing (Parks & Recreation / Community Development / Sewerage & Waste Management). — Federal / state & local governments share financial responsibility in Medicaid and Unemployment Insurance. e We Focus on the Federal Government — State and local governments face many similar long-term financial challenges and may ultimately require federal assistance. To be sure, the size of state & local government budget deficits ($70 billion’ in aggregate in F2009) and debt-to-GDP ratio (7%? on average in F2008) pales by comparison to the federal government's ($1.3 trillion budget deficit, 62% debt-to-GDP ratio in F2010). But these metrics may understate state & local governments’ financial challenges by 50% or more@ because they exclude the long-term cost of public pension and other post employment benefit (OPEB) liabilities. Note: 1) Per National Conference of State Legislatures, State fiscal years ends in June. $70B aggregate excludes deficits from Puerto Rico ($3B deficits in F2009). 2) Debt-to-GDP ratio per Census Bureau State & Local Government Finance; 3) Calculation based on the claim that $1T of collective short fall in State & local government pension and OPEB funding KP would be $2.5T using corporate accounting rules, per Orin S. Kramer, “How to Cheat a Retirement Fund,” 9/10. (@E) www.kpcb.com USA Inc. | Introduction 12 HOUSE_OVERSIGHT_020847
Sponsored
Page 25 - HOUSE_OVERSIGHT_020848
Summary KP i USA Inc. | Introduction 13 Highlights from F2010 USA Inc. Financials e Summary — USA Inc. has challenges. e Cash Flow — While recession depressed F2008-F2010 results, cash flow has been negative for 9 consecutive years ($4.8 trillion, cumulative), with no end to losses in sight. Negative cash flow implies that USA Inc. can't afford the services it is providing to 'customers,’ many of whom are people with few alternatives. e Balance Sheet — Net worth is negative and deteriorating. e Off-Balance Sheet Liabilities — Off-balance sheet liabilities of at least $31 trillion (primarily unfunded Medicare and Social Security obligations) amount to nearly $3 for every $1 of debt on the books. Just as unfunded corporate pensions and other post-employment benefits (OPEB) weigh on public corporations, unfunded entitlements, over time, may increase USA Inc.’s cost of capital. And today’s off-balance sheet liabilities will be tomorrow’s on-balance sheet debt. e Conclusion — Publicly traded companies with similar financial trends would be pressed by shareholders to pursue a turnaround. The good news: USA Inc.’s underlying asset base and entrepreneurial culture are strong. The financial trends can shift toward a positive direction, but both ‘management’ and ‘shareholders’ will need collective focus, willpower, commitment, and sacrifice. Note: USA federal fiscal year ends in September, Cash flow = total revenue — total spending on a cash basis; net worth includes unfunded future liabilities from Social Security and Medicare on an accrual basis over the next 75 years. Source: cash flow per White House Office of Management and Budget; net worth per Dept. of Treasury, “2010 Financial Report of the U.S. KP Government,” adjusted to include unfunded liabilities of Social Security and Medicare. (@E) www.kpcb.com USA inc. | Introduction 14 HOUSE_OVERSIGHT_020848
Page 26 - HOUSE_OVERSIGHT_020849
Drilldown on USA Inc. Financials... e To analysts looking at USA Inc. as a public corporation, the financials are challenged - Excluding Medicare / Medicaid spending and one-time charges, USA Inc. has supported a 4% average net margin’ over 15 years, but cash flow is deep in the red by negative $1.3 trillion last year (or -$11,000 per household), and net worth2 is negative $44 trillion (or -$371,000 per household). e The main culprits: entitlement programs, mounting debt, and one-time charges — Since the Great Depression, USA Inc. has steadily added “business lines” and, with the best of intentions, created various entitlement programs. Some of these serve the nation’s poorest, whose struggles have been made worse by the financial crisis. Apart from Social Security and unemployment insurance, however, funding for these programs has been woefully inadequate — and getting worse. - Entitlement expenses (adjusted for inflation) rose 70% over the last 15 years, and USA Inc. entitlement spending now equals $16,600 per household per year; annual spending exceeds dedicated funding by more than $71 trillion (and rising). Net debt levels are approaching warning levels, and one-time charges only compound the problem. - Some consider defense spending a major cause of USA Inc.'s financial dilemma. Re-setting priorities and streamlining could yield savings — $788 billion by 2018, according to one recent study*@ — perhaps without damaging security. But entitlement spending has a bigger impact on USA Inc. financials. Although defense nearly doubled in the last decade, to 5% of GDP, it is still below its 7% share of GDP from 1948 to 2000. It accounted for 20% of the budget in 2010, but 41% of all government spending between 1789 and 1930. Note: 1) Net margin defined as net income divided by total revenue; 2) net worth defined as assets (ex. stewardship assets like national parks and heritage assets like the Washington Monument) minus liabilities minus the net present value of unfunded entitlements (such as Social Security and Medicare), data per Treasury Dept.'s “2010 Annual Report on the U.S. Government’, 3) Gordon Adams and Matthew Leatherman, “A Leaner and Meaner National Defense,” Foreign Affairs, Jan/Feb 2011) www.kpcb.com USA Inc. | Introduction 15 ...Drilldown on USA Inc. Financials... e Medicare and Medicaid, largely underfunded (based on ‘dedicated’ revenue) and growing rapidly, accounted for 21% (or $724B) of USA Inc.’s total expenses in F2010, up from 5% forty years ago - Together, these two programs represent 35% of all (annual) US healthcare spending; Federal Medicaid spending has doubled in real terms over the last decade, to $273 billion annually. e Total government healthcare spending consumes 8.2% of GDP compared with just 1.3% fifty years ago; the new health reform law could increase USA Inc.’s budget deficit - As government healthcare spending expands, USA Inc.’s red ink will get much worse if healthcare costs continue growing 2 percentage points faster than per capita income (as they have for 40 years). e Unemployment Insurance and Social Security are adequately funded...for now. The future, not so bright - Demographic trends have exacerbated the funding problems for Medicare and Social Security — of the 102 million increased enrollment between 1965 and 2009, 42 million (or 41%) is due to an aging population. With a 26% longer life expectancy but a 3% increase in retirement age (since Social Security was created in 1935), deficits from Social Security could add $11.6 trillion (or 140%) to the public debt by 2037E, per Congressional Budget Office (CBO). KP a USA Inc. | Introduction 16 HOUSE_OVERSIGHT_020849
Page 27 - HOUSE_OVERSIGHT_020850
...Drilldown on USA Inc. Financials e If entitlement programs are not reformed, USA Inc.’s balance sheet will go from bad to worse - Public debt has doubled over the last 30 years, to 62% of GDP. This ratio is expected to surpass the 90% threshold* — above which real GDP growth could slow considerably — in 10 years and could near 150% of GDP in 20 years if entitlement expenses continue to soar, per CBO. - As government healthcare spending expands, USA Inc.’s red ink will get much worse if healthcare costs continue growing 2 percentage points faster than per capita income (as they have for 40 years). e The turning point: Within 15 years (by 2025), entitlements plus net interest expenses will absorb all — yes, all — of USA Inc.’s annual revenue, per CBO - That would require USA Inc. to borrow funds for defense, education, infrastructure, and R&D spending, which today account for 32% of USA Inc. spending (excluding one-time items), down dramatically from 69% forty years ago. - It's notable that CBO’s projection from 10 years ago (in 1999) showed Federal revenue sufficient to support entitlement spending + interest payments until ZOG0E — 35 years later than current projection. Note: *Carmen Reinhart and Kenneth Rogoff observed from 3,700 historical annual data points from 44 countries that the relationship between government debt and real GDP growth is weak for debt/GDP ratios below a threshold of 90 percent of GDP. Above 90 percent, median growth rates fall by one percent, and average growth falls considerably more. We note that while Reinhart and Rogoff’s observations are based on ‘gross debt’ data, in the U.S., debt held by the public is closer to the European KP countries’ definition of government gross debt. For more information, see Reinhart and Rogoff, “Growth in a Time of Debt,” 1/10. (@)E) www.kpcb.com USA Inc. | Introduction 17 How Might One Think About Turning Around USA Inc.?... e Key focus areas would likely be reducing USA Inc.’s budget deficit and improving / restructuring the ‘business model’... — One would likely drill down on USA Inc.’s key revenue and expense drivers, then develop a basic analytical framework for ‘normal’ revenue / expenses, then compare options. Looking at history... — Annual growth in revenue of 3% has been roughly in line with GDP for 40 years* while corporate income taxes grew at 2%. Social insurance taxes (for Social Security / Medicare) grew 5% annually and now represent 37% of USA Inc. revenue, compared with 19% in 1965. — Annual growth in expenses of 3% has been roughly in line with revenue, but entitlements are up 5% per annum - and now absorb 51% of all USA Inc.’s expense - more than twice their share in 1965; defense and other discretionary spending growth has been just 1-2%. One might ask... — Should expense and revenue levels be re-thought and re-set so USA Inc. operates near break-even and expense growth (with needed puts and takes) matches GDP growth, thus adopting a ‘don’t spend more than you earn’ approach to managing USA Inc.'s financials? Note: *We chose a 40-year period from 1965 to 2005 to examine ‘normal’ levels of revenue and expenses. We did not choose the most recent 40-year period (1969 to 2009) as USA was in deep recession in 2008 / 2009 and underwent significant tax policy fluctuations in 1968 /1969, so KP many metrics (like individual income and corporate profit) varied significantly from ‘normal’ levels. (@E) www.kpcb.com USA Inc. | Introduction 18 HOUSE_OVERSIGHT_020850
Sponsored
Page 28 - HOUSE_OVERSIGHT_020851
... How Might One Think About Turning Around USA Inc.? One might consider... e Options for reducing expenses by focusing on entitlement reform and operating efficiency — Formula changes could help Social Security's underfunding, but look too draconian for Medicare/Medicaid; the underlying healthcare cost dilemma requires business process restructuring and realigned incentives. - Resuming the 20-year trend line for lower Federal civilian employment, plus more flexible compensation systems and selective local outsourcing, could help streamline USA Inc.’s operations. e Options for increasing revenue by focusing on driving long-term GDP growth and changing tax policies - USA Inc. should examine ways to invest in growth that provides a high return (ROI) via new investment in technology, education, and infrastructure and could stimulate productivity gains and employment growth. — Reducing tax subsidies (like exemptions on mortgage interest payments or healthcare benefits) and changing the tax system in other ways could increase USA Inc.’s revenue without raising income taxes to punitive — and self-defeating — levels. Such tax policy changes could help re-balance USA’s economy between consumption and savings and re-orient business lines towards investment-led growth, though there are potential risks and drawbacks. e History suggests the long-term consequences of inaction could be severe - USA Inc. has many assets, but it must start addressing its spending/debt challenges now. KP i USA Inc. | Introduction 19 Sizing Costs Related to USA Inc.’s Key Financial Challenges & Potential AND / OR Solutions e To create frameworks for discussion, the next slide summarizes USA Inc.’s various financial challenges and the projected future cost of each main expense driver. — The estimated future cost is calculated as the net present value of expected ‘dedicated’ future income (such as payroll taxes) minus expected future expenses (such as benefits paid) over the next 75 years. e Then we ask the question: ‘What can we do to solve these financial challenges?’ — The potential solutions include a range of simple mathematical illustrations (such as changing program characteristics or increasing tax rates) and/or program-specific policy solutions proposed or considered by lawmakers and agencies like the CBO (such as indexing Social Security initial benefits to growth in cost of living). e These mathematical illustrations are only a mechanical answer to key financial challenges and not realistic solutions. In reality, a combination of detailed policy changes will likely be required to bridge the future funding gap. KP a USA Inc. | Introduction 20 HOUSE_OVERSIGHT_020851
Page 29 - HOUSE_OVERSIGHT_020852
Overview of USA Inc.’s Key Financial Challenges & Potential and/or Solutions Financial Net Present Cost! Mathematical Illustrations Rank Challenge ($T / % of 2010 GDP) and/or Potential Policy Solutions? * Isolate and address the drivers of medical cost inflation 1 Medicaid $35 Trillion / 239% + Improve efficiency / productivity of healthcare system ¢ Reduce coverage for optional benefits & optional enrollees ¢ Reduce benefits « Increase Medicare tax rate : Metis pe SOMUUESLE SES L Isolate and address the drivers of medical cost inflation * Improve efficiency / productivity of healthcare system * Raise retirement age * Reduce benefits Social ah 5 * Increase Social Security tax rate : Security Gemalion ¢ Reduce future initial benefits by indexing to cost of living growth rather than wage growth * Subject benefits to means test to determine eligibility von GDP / * Invest in technology / infrastructure / education 4 -- * Remove tax & regulatory uncertainties to stimulate employment growth Revenue ai F * Reduce subsidies and tax expenditures & broaden tax base Growth * Resume the 20-year trend line for lower Federal civilian employment Government : ‘ 5 mer -- * Implement more flexible compensation systems Inefficiencies ; ; f ; * Consolidate / selectively local outsource certain functions Note: 1) Net Present Cost is calculated as the present value of expected future net liabilities (expected revenue minus expected costs) for each program / issue over the next 75 years, Medicare estimate per Dept. of Treasury, “2010 Financial Report of the U.S. Government,” Social Security estimate per Social Security Trustees’ Report (8/10). 2) For more details on potential solutions, see slides 252-410 or full USA Inc. presentation. 3) Medicaid does not have dedicated revenue source and its $35T net KP present cost excludes funding from general tax revenue, NPV analysis based on 3% discount rate applied to CBO’s projection for annual inflation-adjusted expenses. (@)E) www.kpcb.com USA Inc. | Introduction 21 The Essence of America’s Financial Conundrum & Math Problem? While a hefty 80% of Americans indicate balancing the budget should be one of the country’s top priorities, per a Peter G. Peterson Foundation survey in 11/09... ...only 12% of Americans support cutting spending on Medicare or Social Security, per a Pew Research Center survey, 2/11. Some might call this ‘having your cake and eating it too...’ KP a USA Inc. | Introduction 22 HOUSE_OVERSIGHT_020852
Page 30 - HOUSE_OVERSIGHT_020853
The Challenge Before Us Policymakers, businesses and citizens need to share responsibility for past failures and develop a plan for future successes. Past generations of Americans have responded to major challenges with collective sacrifice and hard work. Will ours also rise to the occasion? (@)E) www.kpcb.com USA Inc. | Introduction 23 HOUSE_OVERSIGHT_020853
Sponsored
Page 31 - HOUSE_OVERSIGHT_020854
High-Level Thoughts on Income Statement/Balance Sheet KP CC —— USA Inc. | High Level Thoughts 25 How Would You Feel if... ...your Cash Flow was NEGATIVE for each of the past 9 years... ... your Net Worth* has been NEGATIVE for as long as you can remember... ... t would take 20 years of your income at the current level to pay off your existing debt — assuming you don't take on any more debt. KP Note: *See slide 30 for net worth qualifier. Ce USA Inc. | High Level Thoughts 26 HOUSE_OVERSIGHT_020854
Page 32 - HOUSE_OVERSIGHT_020855
Welcome to the Financial Reality (& Negative Trend) of USA Inc. F2010 Cash Flow = -$1.3 Trillion; Net Worth = -$44 Trillion USA Inc. Annual Cash Flow & Year-End Net Worth, F1996 — F2010 BAGS 6 m2 ce me — mn ae oc ms mn = a ws — a HS $15,000 $0 oe = < 8 s z al 3 -$15,000 <= £ 2 ° a = = ‘ _ a Q = CE) De oe er -- $30,000 F 3 7 2 mm One-Time Expenses* ul < ty] $ " ‘ a A $1,200 mmm Cash Flow (leftaxis) = - A -$45,000 >= Net Worth (right axis) ¥ $1600 oo -$60,000 F1996 F1998 F2000 F2002 F2004 F2006 F2008 F2010 Note: USA federal fiscal year ends in September; Cash flow = total revenue — total spending on a cash basis; net worth includes unfunded future liabilities from Social Security and Medicare on an accrual basis over the next 75 years. *One-time expenses in F2008 include $14B payments to Freddie Mac; F2009 includes $279B net TARP payouts, $97B payment to Fannie Mae & Freddie Mac and $40B stimulus spending on discretionary items; F2010 includes $26B net TARP income, $137B stimulus spending and $41B payment to Fannie Mae & Freddie Mac. F2010 net worth improved dramatically owing to revised actuarial estimates for Medicare program resulted from the Healthcare reform legislation. For more definitions, see next slide. Source: cash flow per White House Office KP of Management and Budget; net worth per Dept. of Treasury, “2010 Financial Report of the U.S. Government.” www.kpcb.com USA Inc. | High Level Thoughts 27 Think About That... The previous chart is in TRILLIONS of dollars. Just because million, billion and trillion rhyme, doesn't mean that they are even close to the same quantity. KP a USA Inc. | High Level Thoughts 28 HOUSE_OVERSIGHT_020855
Page 33 - HOUSE_OVERSIGHT_020856
Only Politicians Work in Trillions of Dollars— Here’s How Much That Is *™ 1 Pallet x 1 Football Field and $41 Million (MM) 217 Football Fields $1 Billion (B) = Le. Trillion (T) ae aa (@E www.kpcb.com USA Inc. | High Level Thoughts 29 Net Worth Qualifier ¢ The balance sheet / net worth calculation does not include the power to tax — the net present value of the sovereign power to tax and the ability to print the world’s reserve currency would clearly bolster USA Inc.’s assets — if they could be accurately calculated. * Plant, Property & Equipment (PP&E) on USA Inc.’s balance sheet is valued at $829B' (or 29% of USA Inc.’s total stated assets) — this includes tangible assets such as buildings, internal use software and civilian and military equipment. * The PP&E calculation DOES NOT include the value of USA Inc.’s holdings in the likes of public land (estimated to be worth $408B per OMB)’, highways, natural gas, oil reserves, mineral rights (estimated to be worth $345B per OMB), forest, air space, radio frequency spectrum, national parks and other heritage and stewardship assets which USA Inc. does not anticipate to use for general government operations. The good news for USA Inc. is that the aggregate value of these heritage and stewardship assets could be significant. Note: 1) USA Inc.’s holding of land is measured in non-financial units such as acres of land and lakes, and number of National Parks and National Marine Sanctuaries. Land under USA Inc.’s stewardship accounts for 28% of the total U.S. landmass as of 9/10. Dept. of Interior reported 552 national wildlife refuges, 378 park units, 134 geographic management areas, 67 fish hatcheries under their management as of 9/10. Dept. of Defense reported 203,000 acres of public land and 16,140,000 acres withdrawn public land, the USDA’s Forest Service managed an estimated 155 national forests, while the Dept. of Commerce had 13 National Pp Marine Sanctuaries, which included near—shore coral reefs and open ocean, as of 9/10. Dept. of Treasury, “2010 Financial Report of the U.S. Government.” FSA wearer com USA Inc. | High Level Thoughts 30 HOUSE_OVERSIGHT_020856
Sponsored
Page 34 - HOUSE_OVERSIGHT_020857
A Word of Warning About Comparing Corporate & Government Accounting... e Government accounting standards do not report the present value of future entitlement payments (such as Social Security or Medicare) as liabilities. Instead, entitlement payments are recognized only when they are paid. Our analysis takes a different view: governments create liabilities when they enact entitlements and do not provide for revenues adequate to fund them. e We measure the entitlement liability as the present value of estimated entitlement payments in excess of expected revenues for citizens of working age based on Social Security and Medicare Trust Funds’ actuarial analysis. e Government accounting standards also do not recognize the value of internally- generated intangible assets (such as the sovereign power to tax). We do not recognize those assets either, as we have no basis to measure them. But the US government has substantial intangible assets that should provide future economic benefits. Note: For more discussion on alternatives to corporate and official government accounting methods, see Laurence J. Kotlikoff, Alan J. Auerbach, and Jagadeesh okhale, “Generational Accounting: A Meaningful Way to Assess Generational Policy,” published on 12/94 in The Journal of Economic Perspectives. KP Source: Greg Jonas, Morgan Stanley Research. i USA Inc. | High Level Thoughts 31 ...and About Government Budgeting e Federal government budgeting follows arcane practices that are very different from corporate budgeting — and can neglect solutions to structural problems in favor of short-term expediency. e Federal government does not distinguish capital budget (for long-term investment) from operating budget (for day-to-day operations). As a result, when funding is limited, government may choose to reduce investments for the future to preserve resources for day-to-day operations. e Budget “scoring” rules give Congress incentives to hide the true costs...and help Congressional committees defend their turf.” Note: *For more detail, refer to slide 116 on congressional budget scoring rules related to recent Healthcare reform. a USA Inc. | High Level Thoughts 32 HOUSE_OVERSIGHT_020857
Page 35 - HOUSE_OVERSIGHT_020858
Metric Definitions & Qualifiers e Cash Flow = ‘Cash In’ Minus ‘Cash Out’ — Calculated on a cash basis (which excludes changes in non-cash accrual of future liabilities) for simplicity. e One-Time Expenses = ‘Spending Minus Repayments’ for Non-Recurring Programs — Net costs of programs such as TARP, ARRA, and GSE bailouts. e Net Worth = Assets Minus Liabilities Minus Unfunded Entitlement Liabilities — Assets include cash & investments, taxes receivable, property, plant & equipment (as defined by Department of Treasury). — Liabilities include accounts payable, accrued payroll & benefits, federal debt, federal employee & veteran benefits payable... — Unfunded Entitlement Liabilities include the present value of future expenditures in excess of dedicated future revenues in Medicare and Social Security over the next 75 years. Note: USA Inc. accounts do not follow the same GAAP as corporations. i USA Inc. | High Level Thoughts 33 Common Financial Metrics Applied to USA Inc. in F2010 e Cash Flow Per Share = -$4,171 — USA Inc.’s F2010 cash flow -$1.3 trillion, divided by population of ~310 million (assuming each citizen holds one share of USA Inc.). e Net Debt to EBITDA Ratio = -8x — USA Inc. net debt held by public ($9.1 trillion) divided by USA Inc. F2010 EBITDA (-$1.1 trillion). It’s notable that the ratio compares with S8&P500 average of 1.4x in 2010. Note: USA Inc. accounts do not follow the same GAAP as corporations. Refer to slide 31 for a word of warning about comparing corporate and government accounting. EBITDA is Earnings Before Interest, Tax, Depreciation & Amortization. Source: Dept. of Treasury, White House Office of Management and Budget, Congressional Budget Office, BEA, BLS. www.kpcb.com USA Inc. | High Level Thoughts 34 HOUSE_OVERSIGHT_020858
Page 36 - HOUSE_OVERSIGHT_020859
Even Adjusting For Cyclical Impact of Recessions, USA Inc.’s 2010 Structural Operating Loss = -$817 Billion vs. -$78 Billion 15 Years Ago USA Inc. Annual Operating Surplus / Deficit, Structural vs. Cyclical’, F1996 — F2010 GAGE) a eee en es ns cn a a a nn mT aT A EC aT 2 al | ri 1 1 1 $400 ------------------ 5252225252222 | I er ck ta it a ; — a & “$Q00 ce see ee ence = Structural aCyclical ----_-_--_--_ ee Leal - SEA ZOB = <= ae oo ee ce ee ee em ee rem me em ae SER RE ea eR ee eee — » “$1,800 ~~ ~~ = =~ <= 2-2 2-2-2 ee ee ne ee ee ee ee ee F1996 F1998 F2000 F2002 F2004 F2006 F2008 F2010 Note: 1) Congressional Budget Office defines a structural surplus or deficit as the budget surplus or deficit that would occur under current law if the influences of the business cycle on the budget — the automatic stabilizers — were removed, and cyclical surplus or deficit as the automatic net changes in revenues and outlays that are attributable to cyclical movements in real (inflation-adjusted) output and unemployment. CBO compiled this data from Dept. of Commerce’s Bureau of Economic Analysis (BEA), which maintains the national income and product accounts (NIPA). An important difference between the official budget deficit and the NIPA measure of net federal government saving is that the latter excludes such purely financial transactions as the sale of government assets, and most transactions under the Troubled Asset Relief Program, because those transactions do not help to measure current production and income. In addition, historical NIPA data are subject to significant revision; historical budget data, by contrast, are rarely revised significantly. Source: 1996-2006 data per CBO, “The Effects of KP Automatic Stabilizers on the Federal Budget,” 5/10, 2007-2010 data per White House OMB F2012 Budget Analytical Perspective. (@)E) www.kpcb.com USA Inc. | High Level Thoughts 35 Annual Federal Government Surplus / Deficit ($ Billion) Understanding Differences Between Economist Language vs. Equity Investor Translation Economist Language Equity Investor Approximate Translation* e Budget Deficit — The amount by which a e Cash Flow — ‘Cash in’ minus ‘cash out.’ government's expenditures exceed its receipts over a particular period of time. e Structural Deficit = The portion of the e Cash Flow (ex. One-Time Items)* _— budget deficit that results from a ‘Cash in’ minus ‘cash out’ excluding fundamental imbalance in government expenditures that are one-time in nature receipts and expenditures, as opposed to (such as economic stimulus spending). one based on the business cycle or one- time factors. e One-Time Expenses* — TARP / GSE / e Cyclical Deficit — The portion of the stimulus spending related to economic budget deficit that results from cyclical factors such as economic recessions prsevernells rather than from underlying fiscal policy. e Federal Debt Held By the Public — The e Debt — Cumulative negative cash flow accumulation of all previous fiscal years’ financed by borrowing. d fi it Note: *We acknowledge that while the concept of ‘cash flow ex. one-time items’ and ‘one-time expenses’ is similar to ‘structural deficit’ and erlcits. ‘cyclical deficit,’ respectively, these terms are not interchangeable and have different definitions. Congressional Budget Office defines a structural surplus or deficit as the budget surplus or deficit that would occur under current law if the influences of the business cycle on the budget — the automatic stabilizers — were removed, and cyclical surplus or deficit as the automatic net changes in revenues and outlays that KP are attributable to cyclical movements in real (inflation-adjusted) output and unemployment. (@E) www.kpcb.com USA Inc. | High Level Thoughts 36 HOUSE_OVERSIGHT_020859
Sponsored
Page 37 - HOUSE_OVERSIGHT_020860
How Did USA Inc.'s Financial Reality Get to this Difficult Point? USA Inc. Has Not Adequately Funded Its Entitlement Programs Recessions come and go (and affect USA’s revenue), but future claims (related to entitlement program commitments) on USA Inc. now meaningfully exceed its projected cash flows. For the last 40 years, management (the government) has committed more long-term benefits through ‘entitlement’ programs like Medicaid / Medicare / Social Security...without developing a sound plan to pay for them. Many of these programs provide important services to low-income, unemployed, and disabled Americans in great need for help. But without proper financing, support may dwindle. KP i USA Inc. | High Level Thoughts 37 USA Inc. Has Substantially Expanded lts “Business Lines” Over Past 80 Years From 1789 to 1930, 41%!‘ of USA Inc.’s cumulative budget was dedicated to defense spending (compared with 20%! in F2010), per the Census Bureau. This began to change in the 1930s, when the federal government substantially expanded its role (in effect, expanded its “business lines”) in response to the Great Depression. Note: 1) 41% is the cumulative defense spending (excluding veterans’ benefits and services) as % of cumulative total federal spending from 1789 to 1930. including veterans’ benefits and services, defense spending would have been 49% of cumulative annual budget from 1789 to 1930 and would have been 22% in F2009. Source: Census Bureau, “Historical Statistics of the United States, Colonial Times to 1970,” Data series ¥Y 457-465. KP a USA Inc. | High Level Thoughts aw oo HOUSE_OVERSIGHT_020860
Page 38 - HOUSE_OVERSIGHT_020861
USA Inc. “Business Lines” Have Expanded From Defense to Insurance & Other Areas USA Inc. Major ‘Business Line’ Spending as % of GDP, F1800 vs. F1900 vs. F2000 F1800 F1900 F2000 2.2% 2.5% 18.2% Defense Other 3.0% 0.3% Defense 1.3% Note: Fiscal year 1800/1900 ended in June. Fiscal year 2000 ended in September. *Health insurance includes Medicare, Medicaid (federal portion) and other federal health programs, retirement and disability insurance is Social Security. Other spending includes public sector employee and veteran pension & benefits cost and spending on community development, law enforcement / education / public infrastructure / energy, etc. Source: 1800 / KP 1900 data per Census Bureau, 2000 per White House OMB. (@)E) www.kpcb.com USA Inc. | High Level Thoughts 39 Defense 0.9% nterest Payment 0.2% USA Inc. First 155 Years (1776-1930) = Era of Defense Dept. of Army + Navy = 41%! of Cumulative Spending From 1789-1930 USA Inc.’s Budget Outlays For the First 155 Years (1776-1930)? 1789-1930 1789-1791 ... 1800 ... 1850 ... 1900 ... 1930 Cumulative Total Federal Government Outlays ($MM) $4 $11 $40 $521 $3,320 $98,747 Defense $191 $839 $40,332 % of Total Outlays 37% 25% 41% Dept. of the Army $1 $3 $9 $135 $465 $28,831 % of Total Outlays 15% 24% 24% 26% 14% 29% Dept. of the Navy $0 $3 $8 $56 $374 $11,500 % of Total Outlays - 32% 20% 11% 11% 12% Interest on the Public Debt $2 $3 $4 $40 $659 $13,790 % of Total Outlays 55% 31% 10% 8% 20% 14% Other* $1 $1 $18 $290 $1,822 $44,626 % of Total Outlays 30% 13% 47% 56% 55% 45% Veteran Compensation and Pensions $0 $0 $2 $141 $221 $8,273 % of Total Outlays 4% 1% 5% 27% 7% 8% Note: Data is rounded and not adjusted for inflation. 1) 41% is the cumulative defense spending (excluding veterans’ benefits and services) as % of cumulative total federal spending from 1789 to 1930. Including veterans’ benefits and services, defense spending would have been 49% of cumulative annual budget from 1789 to 1930. 2) Data not available from 1776 to 1789. * Other includes various spending on administration, legislation and veteran K P compensation and pensions. Source: Census Bureau, “Historical Statistics of the United States, Colonial Times to 1970,” Data series Y 457-465. a USA Inc. | High Level Thoughts 40 HOUSE_OVERSIGHT_020861
Page 39 - HOUSE_OVERSIGHT_020862
USA Inc. Next 80 Years (1931-2010) = Era of Expansion Defense Down to 20% of Spending; Social Security + Healthcare Up to 44% in F2010 USA Inc.’s Budget Outlays For the Next 78 Years (1931-2010) 1931 1940 _.. 1950. 1960 _._ 1970 _. 1980 __ 1990 _, 2000 __. 2010 Total Federal Government Outlays ($B) $4 $9 $43 $92 $196 $591 $1,253 $1,789 $3,456 Defense $1 $2 $14 $48 $82 $134 $299 $294 $694 % of Total Outlays 23% 20% 32% 52% 42% 23% 24% 16% 20% Interest on the Public Debt $1 $1 $5 $7 $14 $53 $184 $223 $196 % of Total Outlays 17% 11% 11% 8% 7% 9% 15% 12% 6% Retirement & Disability Insurance $0 $0 $1 $12 $30 $119 $249 $409 $707 % of Total Outlays 0% 0% 2% 13% 15% 20% 20% 23% 20% Healthcare $0 $0 $0 $1 $12 $55 $156 $352 $821 % of Total Outlays 0% 1% 1% 1% 6% 9% 12% 20% 24% Physical Resources (Energy / Housing...) $0 $2 $4 $8 $16 $66 $126 $85 $89 % of Total Outlays 5% 26% 9% 9% 8% 11% 10% 5% 3% Other $2 $4 $19 $17 $42 $165 $239 $426 $950 % of Total Outlays 55% 42% 45% 18% 21% 28% 19% 24% 27% Note: Data is rounded and not adjusted for inflation. Physical resources include energy, natural resources, commerce & housing credit, transportation infrastructure, community and regional development. Other includes international affairs, agriculture, administration of justice, general government, education and veterans’ benefits and services. Source: 1931-1939 data per Census Bureau, “Historical Statistics of the United States, Colonial Times to 1970.” 1940- K P 2010 data per White House OMB. (@)E) www.kpcb.com USA Inc. | High Level Thoughts 41 USA Inc. “Business Line” Extensions: 1930 — 2010 “Business Line” F2010 Agencies / Programs Extensions Expense ($B) Created (Year) Gaals Heparimentier Emsray Establish the Strategic Petroleum Reserve / Energy Policy $12 (1977) mandate automobile fuel efficiency standards & temporary oil price control F Community ; Community 13 Beelamiiand veh Provide federal grants to local governments for Development projects like parking lots / museums / street repairs Grant* (1974) 4 oa Provide medical insurance program for the elderly Medicare / Medicaid . : Healthcare 724 (Medicare) and welfare program for low-income (1965) : —_ population (Medicaid) Federal Subsidies for Provide federal subsidies for student loans / school Education 97 K-12 & Higher libraries / teacher training / research / textbooks and Education (1965) other items. Federal Housing Reduce cost of mortgages and spur home building / Housing 36 Administration (1937) | purchasing by offering federal mortgage insurance / Fannie Mae (1938) and create secondary market for mortgage loans. Aid ta Dependent Provide cash assistance to low-income families with Welfare 28 Children (1935) children. Replaced by Temiparary Assistance for Needy Families program in 1996 Retirement 584** Social Security (1935) Provide retirement income to the elderly TOTAL $1.5 Trillion Or 10% of F2010 GDP / 69% of USA Inc.’s Revenue / 43 of Expense Note: *Community Development Block Grant was an effort fo consolidate various pre-existing categorical community developmen programs that started with "urban renewal" in the 1950's. **Social Security’s F2010 expense excludes ~$123B payments to KP disabled workers via Disability Insurance program (created in 1956). Source: CATO Institute, White House OMB. (@E) www.kpcb.com USA Inc. | High Level Thoughts 42 HOUSE_OVERSIGHT_020862
Sponsored
Page 40 - HOUSE_OVERSIGHT_020863
Entitlement Programs Are the Largest & Growing Expense Items on USA Inc.'s Income Statement in Peace Time USA Inc. Spending as % of GDP, 1795 — 2010 BB Yo, me mc sce ee em ome = ss sm ee oi ce So SE SS Go — cot om me Age, a All Other Spending = Social Security = Medicare + Medicaid fp ~~ nnn ee BBY = ee ee ee ee ee ee World War Il |->§}------------------------- Federal Spending As % of GDP 0% 1795 1820 1845 1870 1895 1920 1945 1970 1995 Note: Medicaid spending only includes federal (not state) portion of spending. KP Source: John Cogan, Stanford University. (@)E) www.kpcb.com USA Inc. | High Level Thoughts 43 Perspective — USA Entitlement Spending = India’s GDP ¢ With a population of 1.2 billion (vs. USA’s 310 million) and 2010 GDP growth of 10% (vs. USA’s 3%), India is a well- recognized emerging country on the global stage. ¢ It’s notable that India’s 2010 nominal GDP* of $1.43 trillion was equal to USA’s $1.43 trillion in federal government spending on Social Security, Medicare, and Medicaid. Note: *Nominal GDP is not adjusted for purchasing power parity (PPP). Population and GDP data per IMF. a USA Inc. | High Level Thoughts 44 HOUSE_OVERSIGHT_020863
Page 41 - HOUSE_OVERSIGHT_020864
The Original Estimates of Medicare’s Costs Were Vastly Underestimated * In 1965, the official estimate of Medicare’s costs was $500 million per year, roughly $3 billion in 2005 dollars.* * The actual cost of Medicare has turned out to be 10x that estimate. - Medicare’s actual net loss (tax receipts + trust fund interest — expenditures) has exceeded $3 billion (adjusted for inflation) every year since 1976 and was $146 billion in 2008 alone. In other words, had the original estimate been accurate, the cumulative 43-year cost since Medicare was created would have been $129 billion, adjusted for inflation. - In fact, the actual cumulative spending has been $1.4 trillion** (adjusted for inflation)...in effect, 10x over budget. * While calculations have been flawed from the beginning for some of USA Inc.’s entitlement programs, little has been done to correct the problems. An accurate economic forecast might have sunk Medicare. David Blumenthal and James Morone “The Lessons of Success — Revisiting the Medicare Story”, November 2008 Sources: * Lyndon B. Johnson Library & Museum. Medicare spending data per White House OMB. “Dept. of Health & Human Services, CMS, data adjusted for inflation based on BEA’s GDP price index. (@)E) www.kpcb.com USA Inc. | High Level Thoughts 45 Many Leaders Have Voiced Concerns About Entitlement Program Math / Spending The entitlement programs are not self-funded...they are unfunded liabilities. They are the single biggest component of spending going forward. -- Ben Bernanke, Chairman of the Federal Reserve Testimony before House Budget Committee, June 9, 2010 The time we have is growing short...there are serious questions, most immediately about the sustainability of our commitment to growing entitlement programs. -- Paul Volcker, Former Chairman of the Federal Reserve Chairman of President Obama’s Economic Recovery Advisory Board Speech at Stanford University, May 18, 2010 KP a USA Inc. | High Level Thoughts 46 HOUSE_OVERSIGHT_020864
Page 42 - HOUSE_OVERSIGHT_020865
40-Year USA Inc. Data Points and Trends “65-05 1965 2005 Change National’ Healthcare Spending as % of GDP 6% > 16% 167% Federal? Healthcare Spending as % of GDP 1 > 5 o Out-of-Pocket Healthcare Spending as % of GDP 3 > 2 - % of Adult Population Considered Obese 13 > 32 146 % of Americans Receiving Govt. Subsidy? 20 > 35 75 % of Americans that Pay No Federal Income Tax 20 > 33 65 National’ Education Spending as % of GDP 5 > 7 48 Federal Education Spending as % of GDP > 1 -- Gross Debt as % of GDP 47 => 64 36 Interest Payments as % of GDP 1.2 > 1.5 25 Gini Index of Income Inequality4 0.344 > 0.41 20 Net Debt@ as % of GDP 38 > 37 -3 People Below Poverty Level as % of Population 17 => 13 -26 Defense Spending as % of GDP 7 => 4 -33 % of Americans that Pay 50% of All Income Tax 106 > & -60 Federal Budget Surplus / Deficit as % of GDP -0.2 > -3 - Note: 1) Includes all government and private spending. 2) Includes federal spending on Medicare, Medicaid and other healthcare programs, excludes state spending on Medicaid. 3) % of Americans receiving government subsidy include ail recipients of Social Security, Medicare and Medicaid, as well as government employees (inci. federal / state /local / military). Data excludes our estimated duplicates. 4) A Gini index of 0 implies perfect income equality and an index of 1 implies complete inequality, the higher the index, the more inequality there is. Earliest data for USA was measured in 1967. 5) Net debt is federal debt held by the public. 6) Earliest data available in 1980. Source: White House Office of K Management and Budget, Department of Health & Human Services, Centers for Disease Control, internal Revenue Service, Census Bureau. (@)E) www.kpcb.com USA Inc. | High Level Thoughts 47 Summary: 40-Year USA, Inc. Trends* e America is spending beyond its means, and the problem — with mounting losses & increasing debt — is getting worse, not better e Healthcare spending and obesity are rising dramatically. e Education spending is growing slower than healthcare spending. e Defense spending is declining on relative basis. e More and more Americans are on the government payroll or receive government subsidies for retirement income, medical care, housing, and food. e Inequality of income and wealth is rising, and fewer Americans pay income taxes to support USA Inc. e Government increasingly resorts to borrowing to fund rising spending levels (primarily for entitlement programs)... Note: *We chose a 40-year period from 1965 to 2005 to examine ‘normal’ levels of data points and trends. We did not choose the most recent 40-year period (1969 to 2009) as USA was in deep recession in 2008 / 2009 and underwent Significant tax policy fluctuations in 1968 /1969 and subsequently many metrics (like individual income and corporate KP profit as well as federal budget surplus / deficit and debt levels) were significantly off their ‘normal’ levels. (@E) www.kpcb.com USA Inc. | High Level Thoughts 48 HOUSE_OVERSIGHT_020865
Sponsored
Page 43 - HOUSE_OVERSIGHT_020866
What’s the Proper Level of This and That? What's Normal? We begin with the premise that for an enterprise (even a country that can ‘print money’ and tax) to be sustainable, it cannot lose money on an ongoing basis. Successful businesses (and households) typically base their expenses on their ability to generate present and future revenue - in other words, they don’t spend unless they can pay. We analyze the data and present scenarios and options for solving the math and financial challenges facing USA Inc. KP i USA Inc. | High Level Thoughts 49 This page is intentionally left blank. HOUSE_OVERSIGHT_020866
Page 44 - HOUSE_OVERSIGHT_020867
HOUSE_OVERSIGHT_020867
Page 45 - HOUSE_OVERSIGHT_020868
Income Statement Drilldown KP i USA Inc. | Income Statement Drilldown 53 Income Statement — USA Inc. Shows -8% Median Net Margin Over 15 Years USA Inc. Annual Net Income & Median Net Margin, F1996 — F2010 1 0% o & 7) —_ 5 - 40% & [) < c = 3 > ov @ z = 2 80% 2 4 mas Net Income ($B) 2 —— 15-Year Median Net Margin (%) BAA OY mem em se ee mee en a = om a ae = SU ane a SH i 120% BB EB = mm me me en ne a n= tM 9 Aa 9 Ma = 160% F1996 F1998 F2000 F2002 F2004 F2006 F2008 F2010 Wg Note: USA federal fiscal year ends in September. Source: White House Office of Management and Budget. a USA Inc. | Income Statement Drilldown 54 HOUSE_OVERSIGHT_020868
Sponsored
Page 46 - HOUSE_OVERSIGHT_020869
Income Statement — F2010 USA Inc. Revenues + Expenses at a Glance F2010 Revenue = F2010 USA Inc. Expenses = $2.2 Trillion $3.5 Trillion Entitlement Net Interest Programs Payment Discretionary $196B One-Time Items $152B Social Security $707B Other $208B Corporate Individual Income Tax Eine THE Non-Defense $191B $899B See, Defense psi i i 694B Social $ Medicaid Insurance Tax $724B $865B Unemployment Insurance + Other Entitlements $553B Note: USA federal fiscal year ends in September; *individual & corporate income taxes include capital gains taxes. Non- defense discretionary includes federal spending on education, infrastructure, law enforcement, judiciary functions... KP Source: White House Office of Management and Budget. i USA Inc. | Income Statement Drilldown 55 Income Statement — USA Inc. Supported -60% Net Margin in F2010 USA Inc. Profit & Loss Statement, F1995 / F2000 / F2005 / F2010 F1995 .., £2000 ..,F2005 ._,, F2010 Comments Revenue ($B) $1,352 $2,026 $2,154 On average, revenue grew 3% Y/Y Y/Y Growth -~- 11% 15% 3% over past 15 years Individual Income Taxes* $590 $1,005 $927 $899 Largest driver of revenue % of Revenue 44% 50% 43% 42% Social Insurance Taxes $484 $653 $794 $865 Payroll tax on Social Security + % of Revenue 36% 32% 37% 40% Medicare Corporate Income Taxes* $157 $207 $278 $191 Fluctuates significantly with % of Revenue 12% 10% 13% 9% economic conditions Other $120 $161 $154 $208 Includes estate & gift taxes / duties & % of Revenue 9% 8% 7% 10% fees; relatively stable Expense ($B) $1,516 $1,789 $2,472 $3,456 "On average, expense grew 6% YIY Y/Y Growth = 5% 8% -2% over past 15 years Entitlement / Mandatory $788 $937 $1,295 $1,984 Significant increase owing to aging % of Expense 52% 52% bat °7% population + rising healthcare cost Non-Defense Discretionary $223 $335 $497 $431 Tela screatien dE | fi t % of Expense 15% 19% 20% 12% ncludes education / law enforcemen / transportation... Wal Expense ~ ~ ~ en Includes discretionary spending on TARP, GSE id ic stimul Defense $272 $294 $495 $604 Si fie ‘i eee ina ta sums % of Expense 18% 16% 20% 20% ignificant increase owing to on- going War on Terror Net Interest on Public Debt $232 $223 $184 $196 Decreased owing to historic low % of Expense 15% 12% 7% 6% interest rates Surplus / Deficit ($B) -$164 $237 -$318 [_ $1,293 | USA Inc. median net margin Net Margin (%) -12% 12% -15% 60% between 1995 & 2010 = -8% Note: USA federal fiscal year ends in September; *individual & corporate income taxes include capital gains taxes. Non- defense discretionary includes federal spending on education, infrastructure, law enforcement, judiciary functions... KP Source: White House Office of Management and Budget. (@E) www.kpcb.com USA Inc. | Income Statement Drilldown 56 HOUSE_OVERSIGHT_020869
Page 47 - HOUSE_OVERSIGHT_020870
Income Statement — Excluding ‘Underfunded’ Medicare / Medicaid’ + One-Time Charges, USA Inc. Shows 4% Median Net Margin Over 15 Years USA Inc. Annual Net Income & Median Net Margin (Excluding Medicare / Medicaid & One-Time Charges), F1996 — F2010 oO & a —_ E SS : = s c 2 3 78200 @ -- i 20% + = z < o S §A00 ao] ence aes er ee ee oes os en Gm eT gt Se Gn YS SG GU TG A me -- - -40% mas Net Income (ex. Medicare / Medicaid / One-Time Charges) ($B) -$600 um 60% —— 15-Year Median Net Margin (%) “$800 ~~ --- <= 22 ee oe eee ee ee ee ee ee eee 80% Fi996 = F1998 «= F2000.=«Ss«F2002.=«Ss«F2004.«=S ss F2006«=— ss F2008 «= F2010 Note: 1) Excludes both ‘dedicated’ revenue and spending for Medicare and Medicaid. USA federal fiscal year ends in KP September. Source: White House Office of Management and Budget. (@)E) www.kpcb.com USA Inc. | Income Statement Drilldown 57 Income Statement: USA Inc. Profit & Loss Statement Is Solid, Excluding ‘Underfunded’ Medicare / Medicaid Revenue and Spending + One-Time Charges USA Inc. Profit & Loss Statement (ex. Medicare / Medicaid / One-Time Expense), F1995 / F2000 / F2005 / F2010 F1995 ...F2000 ... F2005 ... F2010 Comments Revenue ($B) $1,256 $1,890 $1,988 $1,983 On average, revenue (ex. Medicare) YY Growth _ 11% 15% 4% grew 3% Y/Y over past 15 years Individual Income Taxes* $590 $1,005 $927 $899 Largest driver of core revenue % of Revenue 47% 53% 47% 45% Social Insurance Taxes (ex. Medicare) $388 $517 $628 $685 Payroll tax on Social Security % of Revenue 31% 27% 32% 35% Corporate Income Taxes* $157 $207 $278 $191 Fluctuates significantly with % of Revenue 13% 11% 14% 10% economic conditions Other $120 $161 $154 $208 Includes estate & gift taxes / duties & % of Revenue 10% 9% 8% 10% fees; relatively stable Expense ($B) $1,248 $1,474 $1,992 $2,580 | “Expenses(ex. Medicare Medicaid) Y/Y Growth 5% 8% 7% grew 5% Y/Y over past 15 years Entitlement (ex. Medicare / Medicaid) $520 $622 $815 $1,259 Significant increase owing to aging % of Expense 42% 42% 41% 49% population Non-Defense Discretionary $223 $335 $497 $431 includ ducation /1 fs t % of Expense 18% 23%, 25% 17% ncludes education / law enforcemen / transportation... Defense $272 $294 $495 $694 oo . . % of Expense 22%, 20% 25% 27% Significant increase owing to on- going War on Terror Net Interest on Public Debt $232 $223 $184 $196 . an % of Expense 19% 15% 9% 8% Decreased owing to historic low interest rates Surplus / Deficit ($B) $8 $416 “$4 -$597 USA Inc. core operations were in Net Margin (%) 1% 22% 0% -30% surplus 9 out of the past 15 years Note: USA federal fiscal year ends in September; *individual & corporate income taxes include capital gains taxes. Non-defense discretionary includes KP federal spending on education, infrastructure, law enforcement, judiciary functions... Source: White House Office of Management and Budget. (@E) www.kpcb.com USA Inc. | Income Statement Drilldown 58 HOUSE_OVERSIGHT_020870
Page 48 - HOUSE_OVERSIGHT_020871
100-Year Review of USA Inc.’s Basic Income Statement Including Revenue & Expense Drivers as Percent of GDP 1910 "*" 1920 """ 1930 """ 1940 "*"" 1950 ""* 1960 """ 1970 "*" 1980 """ 1990 """ 2000 ""*| 2008 2009 2010 Revenue ($B) h $7 $4 $7 $41 $92 $193 $517 $1,032 $2,025 [$2,524 $2,105 $2,163 % of GDP 8% 4% 7% 15% 18% 19% 19% 18% 21% 18% 15% 15% Individual Income Taxes $1 $1 $1 $16 $41 $90 $244 $467 $1,004 = $1,146 $915 % of GDP 1% 6% 8% 9% 9% 8% 10% 8% 6% Social Insurance Taxes $2 $4 $15 $45 $158 $380 $653 $900 $891 % of GDP 2% 2% 3% 4% 6% 7% 7% 6% 6% Corporate Income Taxes $1 $1 $10 $21 $33 $65 $94 $207 $304 $138 % of GDP 1% 1% 4% 4% 3% 2% 2% 2% 2% 1% Other* $3 $3 $10 $16 $24 $51 $92 $161 $174 $161 % of GDP 3% 3% 4% 3% 2% 2% 2% 2% 1% 1% Expense ($B) $9 $43 $92 $196 $591 $1,253 $1,789 $2,983 $3,518 $3,456 % of GDP 7% 4% 9% 16% 18% 19% 22% 22% 18% 21% 25% 24% Defense $2 $2 $14 $48 $82 $134 $299 $294 $616 $661 % of GDP 3% 2% 5% 9% 8% 5% 5% 3% 4% 5% Interest on the Debt $1 $5 $7 $14 $53 $184 $223 $253 $187 % of GDP 1% 2% 1% 1% 2% 3% 2% 2% 1% Social Security $0 $1 $12 $30 $119 $249 $409 $617 $683 % of GDP 0% 0% 2% 3% 4% 4% 4% 4% 5% Healthcare $0 $0 $1 $12 $55 $156 $352 $671 $764 % of GDP 0% 0% 0% 1% 2% 3% 4% 5% 5% 6% Other** $6 $23 $25 $57 $231 $365 $511 $825 $1,222 = $1,039 % of GDP 6% 8% 5% 6% 8% 6% 5% 6% 9% 7% Surplus / Deficit ($B) $2 $0 $3 $74 $221 $236 $459 = -$1,413 -$1,293 % of GDP -1% 0% 0% -3% -4% 2% -3% -10% -9% Note: Data are not adjusted for inflation. *Other revenue includes customs and excise / estate taxes. **Other expenses include spending on law enforcement KP / education / public infrastructure / energy, etc. Source: 1910 — 1930 per Census Bureau, 1940-2010 per White House OMB. (@)E) www.kpcb.com USA Inc. | Income Statement Drilldown 59 100-Year Review of USA Inc.’s Basic Income Statement Including Revenue & Expense Drivers as Percent of Revenue & Expenses 1910 =*" 1920 *** 1930 "** 1940 “** 1950 *"* 1960 "** 1970 "*" 1980 "** 1990 "*" 2000 "*"| 2008 2009 2010 Revenue ($B) $0.7 $7 $4 $7 $41 $92 $193 $517 $1,032 $2,025 $2,524 $2,105 $2,163 % of GDP 2% 8% 4% 7% 15% 18% 19% 19% 18% 21% 18% 15% 15% Individual Income Taxes $1 $1 $1 $16 $41 $90 $244 $467 $1,004 $915 % of Revenue 16% 28% 16% 38% 44% 47% 47% 45% 50% 43% Social Insurance Taxes $2 $4 $15 $45 $158 $380 $653 $891 % of Revenue 25% 11% 16% 23% 31% 37% 32% 42% Corporate Income Taxes - $1 $1 $10 $21 $33 $65 $94 $207 $138 % of Revenue - - 31% 14% 26% 23% 17% 12% 9% 10% 7% Other* $0.7 $6 $3 $3 $10 $16 $24 $51 $92 $161 $161 % of Revenue 100% 84% 72% 45% 25% 17% 13% 10% 9% 8% 8% Expense ($B) $0.7 $6 $3 $9 $43 $92 $196 $591 $1,253 $1,789 $2,983 $3,518 $3,456 % of GDP 2% 7% 4% 9% 16% 18% 19% 22% 22% 18% 21% 25% 24% Defense $0.3 $2 $1 $2 $14 $48 $82 $134 $299 $294 $616 $661 $694 % of Expense 45% 37% 25% 20% 32% 52% 42% 23% 24% 16% 21% 19% 20% Interest on the Debt $0 $1 $1 $1 $5 $7 $14 $53 $184 $223 $253 $187 $196 % of Expense 3% 16% 20% 11% 11% 8% 7% 9% 15% 12% 8% 5% 6% Social Security - $0 $1 $12 $30 $119 $249 $409 $617 $683 $707 % of Expense - 0% 2% 13% 15% 20% 20% 23% 21% 19% 20% Healthcare $0 $0 $1 $12 $55 $156 $352 $671 $764 $821 % of Expense 1% 1% 1% 6% 9% 12% 20% 23% 22% 24% Other** $6 $23 $25 $57 $231 $365 $511 $825 $1,222 $1,039 % of Expense 52% 47% 55% 68% 54% 27% 29% 39% 29% 29% 28% 35% 30% Surplus / Deficit ($B) -$0 $0 $1 -$2 -$2 $0 $3 -$74 $221 $236 $459 = -$1,413 _ -$1,293 % of GDP 0% 0% 1% -2% -1% 0% 0% -3% -4% 2% -3% -10% -9% Note: Data are not adjusted for inflation. *Other revenue includes customs and excise / estate taxes. **Other expenses include spending on law enforcement / KP education / public infrastructure / energy, etc. Source: 1910 — 1930 per Census Bureau, 1940-2010 per White House OMB. (@E) www.kpcb.com USA Inc. | Income Statement Drilldown 60 HOUSE_OVERSIGHT_020871
Sponsored
Page 49 - HOUSE_OVERSIGHT_020872
Conclusions: 100-Year Review of USA Inc. Income Statement * America’s government has grown dramatically - USA Inc.’s revenue as percent of GDP has risen from 2% to 15%. Individual / social insurance (Social Security + Medicare) taxes have risen dramatically while customs / excise / estate taxes have declined in relative importance. In addition, USA Inc.’s spending as percent of GDP has risen to 24% in 2010, up from 3% average between 1790 and 1930. ¢ USA Inc.’s average operating income was at or near breakeven for most of the periods from 1910 to 1970. In the 1970s, as healthcare expenses (related to Medicare and Medicaid) began to surge, USA Inc. reported more frequent — and bigger — losses. Since 1970, USA Inc. showed a profit just 4 times (F1998-F2001, when economic growth was especially robust and defense spending was relatively low). ¢ General expense trends since 1970: non-defense discretionary spending has been flattish (except in recessions with material one-time charges), healthcare spending (largely Medicare + Medicaid) has risen materially, Social Security spending has been flattish, defense spending has been down to flattish, and interest payments varied with interest rates. KP i USA Inc. | Income Statement Drilldown 61 Operations of USA Inc. Are Solid, Excluding Medicare / Medicaid and One-Time Charges Revenues of USA Inc. (largely from individual and corporate income and payroll taxes) can fund most expenses (largely spending on defense, Social Security, unemployment insurance, education, law enforcement, transportation, energy, infrastructure, federal employee & veteran benefits, and interest payments). In fact, for USA Inc.'s operations besides Medicare / Medicaid and one-time expenses, there’s ample scope to increase spending for defense, education, law enforcement, transportation, infrastructure and energy by ~4%* in aggregate and still remain break-even. Note: *Excluding Medicare / Medicaid revenue & expenses, USA Inc.’s expenses are, on average, 4% below revenue levels P from F1996 to F2010 based on our calculation of White House OMB data. (@E) www.kpcb.com USA Inc. | Income Statement Drilldown 62 HOUSE_OVERSIGHT_020872
Page 50 - HOUSE_OVERSIGHT_020873
Defense Spending Is The Second-Largest Expense Item After Entitlements, But Below Long-Term Trend as Share of GDP ¢ With budget deficits rising, some advocate cutting back on defense spending, the second-largest expense item after entitlements. ¢ Defense spending has risen substantially in recent years, due to the wars in Afghanistan and Irag, and other costs related to the Global War on Terror. As a percentage of GDP, however, defense spending in the U.S. remains below its 60- year trend. ¢ On an inflation-adjusted basis, U.S. defense spending is at its highest level since World War Il. With overhead ~40% of all spending, the Defense Business Board found DoD consistently pays “more for less” and fails to attack overhead as the private sector would.1 ¢ The Esquire Commission to Balance the Federal Budget, a group of four former Republican and Democratic senators, found over $300 billion? in defense restructuring opportunities, and other analysts proposed gradual cuts to reduce the defense budget by 14% by 2018. 2 Notes: 1) The Defense Business Board , “Reducing Overhead and Improving Business Operations, “July 2010, http://dbb.defense. gov; 2) see Esquire Commission to Balance the Federal Budget, http:/Avww.esquire. com/blogs/politics/federal-budget-statistics-1 110.; 3) Gordon Adams and Matthew K P Leatherman, “A Leaner and Meaner National Defense,” Foreign Affairs, Jan/Feb 2011) (@)E) www.kpcb.com USA Inc. | Income Statement Drilldown 63 Defense Spending Has Risen, Driven by Wars in Afghanistan + Iraq... USA Inc. Inflation-Adjusted* Defense Spending by Type, F1948 - F2010 = Other Vietnam War « RDT&E* $400B --- = Procurement = Operations & $200B --- Maintenance U.S. Inflation-Adjusted Defense Spending ($B) =u Personnel $B 1948 1953 1958 1963 1968 1973 1978 1983 1988 1993 1998 2003 2008 Note: *Adjusted for inflation using GDP price index. **RDT&E is Research, Development, Test & Evaluation. KP Source: White House OMB. (@E) www.kpcb.com USA Inc. | Income Statement Drilldown 64 HOUSE_OVERSIGHT_020873
Page 51 - HOUSE_OVERSIGHT_020874
...While Defense Spending Rose to 5% of GDP in F2010 & Is Up from All-Time Historical Low of 3% in F1999 But It Is Still Well Below Post-World War II (1948-2000) Average of 7% USA Inc. Defense Spending as % of GDP, F1948 - F2010 SEO GDog = mm ee on rs me ca 2 mets = mS = on a = eH Ht SH oh tty = ou nS a a O 15% fn ° ss 2) o>] 2 1948-2000 Average = 7% 2 10% ---]----}---------------------- 2-2-2222 penne eee & | 5% % f a ee ee 3 NS a 2 0% 1 T T T T T T T T T T T T 1948 1953 1958 1963 1968 1973 1978 1983 1988 1993 1998 2003 2008 KP Source: White House OMB. i USA Inc. | Income Statement Drilldown 65 $950 Billion = Cumulative Cost of Iraq, Afghanistan & Global War on Terror Operations Since 9/11/01 Attacks Cumulative Cost of Iraq, Afghanistan & Global War on Terror Operations of $950 Billion, as Percent of F2001-F2009 Spending: 4% of Total F2001-F2009 Federal Spending 22% of Total F2001-F2009 Defense Spending 28% of Total F2001-F2009 Federal Budget Deficit Cumulative Cost of: $685 Billion = War in Iraq $231 Billion = War in Afghanistan $34 Billion = Other Related Operations Source: White House OMB, Congressional Research Service, “The Cost of Iraq, Afghanistan, and Other Global War on Terror K Pp Operations Since 9/11,” 9/2/2010. (@E) www.kpcb.com USA Inc. | Income Statement Drilldown 66 HOUSE_OVERSIGHT_020874
Sponsored
Page 52 - HOUSE_OVERSIGHT_020875
While USA Inc. Ranks # 1 in Defense Spending... Top 25 Countries by 2009 Defense Spending, 2009 GIG = ee eee es cee ses es =r Sos en os Ss tS 3 Sm 5 eh — SA = Ho es = Ho REGS 5 mmm ome 2 aes cence = eae ca ses sn = ot es enn = Se en ES 6 9 UES 3 ND Ee = 9 HD = ED = HH BBE = ae ce em ee ae co mi = me ce Sn et 9 = UE MS EG OE = ES & fo] £ a <c wa a ge SIRI 2 me me we ce ene sae eet — ce Sa es — os 6 t— es hSA S S SS HS eS Sa enh — ea es an fa 3 Bp EER 5 me mre nro 9 ees es ee = ees was ees sen = es semen r= re en ES 6 6 OS SUE 9 ND Ee = 9 DF = GS ED = HH PAG ane sem mem 2 wn cee es mee = a eT TT NE ER ST So oD = lal $- ee se 8 ee ecco eodwn#wWeoeerwe SF GB ZF oseraSe >A BEY Y B £5 @ ¢ tS °° on = GN @ o ic ° c gee see ES EGF ERE SES ESR BRE REP E — — jo — w fees es 6 e@* ¢s * <7 Fee @ £ Pc s < = 3 o 77) 7a 4 =} 2 ° @ o o Note: Data for North Korea unavailable. KP Source: Stockholm International Peace Research Institute. (@)E) www.kpcb.com USA Inc. | Income Statement Drilldown 67 France Ukraine U Israel Oman i ee os - oO = re) 4 ee -- - D £ 3 Fi a 4% oe - o @ a c 3 mail | TEE Il | 0% @& ¢ s Wa @ < S =o % S ¥ & e § 5 > 3 g 5 @ 9 =a 8g a = 2 D i= = S 2 n = oO & Ww = 2s ¢<O05 2 § jaa mg << 6 ros = i) Pakistan South Korea Singapore Saudi Arabia Note: *Ranking among countries with 2009 defense spending of $3 billion or higher; data for North Korea unavailable. K P Source: Stockholm International Peace Research institute. (@E) www.kpcb.com USA Inc. | Income Statement Drilldown 68 HOUSE_OVERSIGHT_020875
Page 53 - HOUSE_OVERSIGHT_020876
While USA Inc. Ranks # 2 in Number of Troops... Top 20 Countries by Active Number of Troops, 2008 BEBII me me o m= are se no we nae mo tw = 8 = em Ne He SM 8 A Aa = BEI meme om = ere ee owe nae eo tw = a em ne He HS mM Bm — oO 3 Sy 1500 a ° £ = a BI awn n-ne enna eR SOR ONT TN Rm Ps — oO << ee ; 7 wae | | > ta ia tel i SOeeeeeel T T T T T T T T T 1 @ a c > iJ @ @ zo] = | = ~ c < ty] @ ty] a ° @ < 2 = a < N 2. cD @ % wo a7) wo 8s ¢< @ 6 2 & $ @ §S§ B & @ EF F 5 BR SF £ G o € £ OO @ = go > § 5 a ° g CS) <¢ 7? £& o.)6 (6S wis Be =< ge S o § BOF > a ¢€ € @ ~ 3° ° no” (77) z KP Source: Stockholm International Peace Research Institute; Center for Strategic and International Studies, Business Monitor International. i USA Inc. | Income Statement Drilldown 69 o NO 40 @ = Oo oO oO S30 Pe nn i 7) a a Fp mw mi mee mw cl en a en th te = = = ~ @ = $ I Tatialdeeenaheiataldes nat |\Rindaaieaeaieianesieeianaeedeniaabiadememnntr ra ioe eo ow lle > BEE auiil T T T T T T T T T T T T T 1 7) ¢ iJ @ = xo} ” iJ = @ a os «¢ > & ” iy] Cy] vo @ o c @ ty] o 8 YH oS 3 OH ir) on WY o > @ 0 TFT & wo cm & 8 ss FR EPGRZFFL ERE eFS¢eSEE S s = 8 i] 5 = = 5 +s uw 5 Ss £ 3 ¥ Ks os olOf#¢& “es 8 O x ££ ga £ 2 este = 6 > 3 < o = i a §& > wi = £ = 5 i] 2 ” ° & 3 B z= <x GS vo = (= 2 Source: Stockholm International Peace Research Institute; Center for Strategic and International Studies, Business Monitor International. a USA Inc. | Income Statement Drilldown 70 HOUSE_OVERSIGHT_020876
Page 54 - HOUSE_OVERSIGHT_020877
Entitlement Spending Medicaid (-$273B Net Loss*) Medicare (-$272B Net Loss*') Unemployment Benefits (-$115B Net Loss*) Social Security (-$75B Net Loss*') Level & Interest Drill Down on USA Inc. Entitlement + Interest + One-Time Expenses for F2010 Periodic Large One-Time Charges Rising Debt Payments Debt Level TARP ($9T Outstanding) ($26B Net Profit*2) Effective Interest Fannie Mae / Rates Freddie Mac (2.2%) (-$41B Net Loss*) ARRA Debt Composition (-$137B Net Loss*) Reinvestment Act programs Note: *denotes F2010 net income / net loss of respective programs, data per White House OMB. 1) Medicare and Social Security net loss excludes Trust Fund interest income. 2) TARP net loss includes proceeds from sale of warrants. TARP is Troubled Asset Relief Program; ARRA is American Recovery & 71 (@)E) www.kpcb.com USA Inc. | Income Statement Drilldown Entitlement Spending Drill Down on USA Inc. Entitlement Spending for F2010 Periodic Large One-Time Rising Debt Level & Interest Payments Charges Note: *denotes F2010 net income / net loss of respective programs, data per White House OMB. 1) Medicare and Social Security net loss excludes Trust Fund interest income. 2) TARP net loss includes proceeds from sale of warrants. TARP is Troubled Asset Relief Program; ARRA is American Recovery & Reinvestment Act programs. 72 (@E) www.kpcb.com USA Inc. | Income Statement Drilldown HOUSE_OVERSIGHT_020877
Sponsored
Page 55 - HOUSE_OVERSIGHT_020878
Entitlement Spending: Lacks Sufficient Dedicated Funding Entitlement programs were created with the best of intentions by the Government. They serve many of the nation’s poorest, whose struggles have been made worse by the financial crisis. However, with the exception of Social Security (which was developed with a pay-as-you-go funding plan and constructed to be legally flexible if conditions change) and unemployment insurance (which was designed to be flexible at State level), other entitlement plans (including Medicaid and Medicare) were developed without sufficient dedicated funding. Here we drill down on the funding trends for entitlement plans ... KP i USA Inc. | Income Statement Drilldown = 73 Entitlement Spending: Expenses Up 2x Over 15 Years Annual Entitlement Spending Per Household = $16,600 per Year USA Inc. Annual Entitlement Programs’ Total & Per-Household Expenses, F1995 — F2010 BAM an nee wo me en em OR TN ER a ST $20,000 mas Entitlement Programs Annual Expenses ($B) $2,000 —— Entitlement Expenses per Household ($) $16,000 $400 Il $0 i T F1995 F1997 F1999 F2001 F2003 F2005 F2007 F2009 $12,000 $8,000 $4,000 USA Inc. Entitlement Total Expenses ($B) & aS) o oO Entitlement Expenses per Household ($) 1 $0 Note: Data are not adjusted for inflation. Entitlement programs include Social Security, Medicare, Medicaid, unemployment benefits, food & nutrition assistance, housing assistance and other. USA federal fiscal year ends in P September; Source: White House Office of Management and Budget. (@E) www.kpcb.com USA Inc. | Income Statement Drilldown 74 HOUSE_OVERSIGHT_020878
Page 56 - HOUSE_OVERSIGHT_020879
Entitlement Spending: Expenses Up 169% Over Past 15 Years, While Dedicated Funding Up Only 70%** F1995 F2000 F2005 F2006 F2007 F2008 F2009 F2010 Entitlement Revenue ($B) $484 $653 $794 $838 $870 $900 $891 $865 Y/Y Growth - 7% 8% 6% 4% 4% -1% -3% Social Security $351 $481 $577 $608 $635 $658 $654 $632 % of Revenue 72% 74% 73% 73% 73% 73% 73% 73% Medicare $96 $136 $166 $177 $185 $194 $191 $180 % of Revenue 20% 21% 21% 21% 21% 22% 21% 21% Medicaid $0 $0 $0 $0 $0 $0 $0 $0 <+ Unemployment Insurance $29 $28 $42 $43 $41 $40 $38 $45 % of Revenue 6% 4% 5% 5% 5% 4% 4% 5% Other* $8 $9 $9 $9 $9 $9 $8 $8 % of Revenue 2% 1% 1% 1% 1% 1% 1% 1% Entitlement Expense ($B) $788 $937 $1,295 $1,357 $1,462 $1,582 $1,834 $1,984 Y/Y Growth - 5% 6% 5% 8% 8% 16% 8% Social Security $336 $409 $523 $549 $586 $617 $683 $707 % of Expense 43% 44% 40% 40% 40% 39% 37% 36% Medicare $160 $197 $299 $330 $375 $391 $430 $452 % of Expense 20% 21% 23% 24% 26% 25% 23% 23% Medicaid $108 $118 $182 $181 $191 $201 $251 $273 % of Expense 14% 13% 14% 13% 13% 13% 14% 14% Unemployment Benefits $24 $23 $35 $34 $35 $45 $123 $160 % of Expense 3% 2% 3% 2% 2% 3% 7% 8% Other* $161 $189 $256 $264 $275 $328 $347 $392 % of Expense 20% 20% 20% 19% 19% 21% 19% 20% Entitlement Surplus / Deficit ($B) -$304 -$284 -$501 -$519 -$592 -$682 -$943 -$1,119 Net Margin (%) -63% -43% -63% -62% -68% -76% -106% -129% Note: USA federal fiscal year ends in September; Medicaid is jointly funded by federal and state governments, and as a social welfare program (unlike a social insurance program like Medicare), there is no dedicated trust fund. “Other expenses include family & other support assistance, earned income tax credit, child tax credit and payments to states for foster care / adoption assistance. **We exclude Social Security & Medicare Part A trust funds interest income as they are accounting gains rather than real revenue. Source: White House Office of Management and Budget. USA Inc. | Income Statement Drilldown 75 (@)E) www.kpcb.com Entitlement Spending: Observation About Social Security & Medicare Part A Trust Fund — More Like Accounting Values Than Real Dollars e Social Security Trust Fund balance (accumulated annual surpluses + interest income) = $2.5 trillion as of 2009; Medicare Part A Trust Fund balance = $304 billion as of 2009. These surpluses were invested in a special (non-marketable) series of U.S. Treasury securities, which were then used to finance budget deficits in other parts of USA Inc. like Medicaid & Nutrition Assistance. e As aresult, many observers have argued that Social Security and Medicare Part A Trust Funds’ balances are no more than accounting gains on paper owing to: 1) no ‘real’ assets (such as tradable stocks / real estates...) in these Trust Funds as the special U.S. Treasury securities are non-marketable and 2) the Treasury Department needs to raise taxes / cut other programs’ spending / borrow more money in the future to meet any withdrawal requests. e We think that for Social Security and Medicare Part A programs, their Trust Funds’ balances have legal value as USA Inc. is legally obliged to repay the principal and interest on the Treasury securities held in respective Trust Funds. e However, we think that these Trust Fund balances have NO economic value as these cumulative surpluses have been spent by USA Inc. to reduce the borrowing need in the past. When Social Security & Medicare begin net withdrawal from their Trust Funds (likely in 2017E), USA Inc.’s debt levels + interest payments growth could accelerate, owing to the double whammy of: 1) loss of revenue source (previous surpluses) and 2) additional Treasury redemption costs related to Trust Funds’ withdrawal requests. e Consequently, we exclude Social Security and Medicare Trust Funds’ balances and interest income from our financial models and calculate their liabilities on a net basis. Data source: Social Security Administration, Dept. of Health & Human Services, CBO. Note: the economic value of Social Security Trust Fund is subject (@E) www.kpcb.com to debate, for a different perspective, refer to Peter Dimond and Peter Orszag, “Saving Social Security: A Balanced Approach,” p51 Box 3-5. USA Inc. | Income Statement Drilldown 76 HOUSE_OVERSIGHT_020879
Page 57 - HOUSE_OVERSIGHT_020880
Entitlement Spending: Non-Partisan CBO Advises Excluding Social Security / Medicare Trust Funds’ Balances + Interest Income in Fiscal Analysis Trust funds can be useful mechanisms for monitoring the balance between earmarked receipts and a program's spending, but they are basically an accounting device, and their balances, even if "invested" in Treasury securities, provide no resources to the government for meeting future funding commitments. When those payments come due, the government must finance them in the same way that it finances other commitments -- through taxes or borrowing from the public. Thus, assessing the state of the federal government's future finances requires measuring such commitments independently of their trust fund status or the balance recorded in the funds. -- Congressional Budget Office (CBO) “Measures of the U.S. Government’s Fiscal Position Under Current Law,” 8/04 KP i USA Inc. | Income Statement Drilldown 77 Entitlement Spending: Funding Patterns of Some Entitlement Programs Work Better than Others Have Worked Relatively Well Financially: Social Security — Has operated at close to break-even - so far - thanks to sufficient payroll tax income from a relatively large working-age population. In fact, Social Security has worked so well, that its surplus net income has been used to finance other government activities such as Medicaid. Unemployment Insurance — Has operated at close to break-even thanks to accumulated net incomes during ‘good years’ (though expenses spiked to $123 billion / $160 billion in 2009 / 2010 from $45 billion in 2008 owing to recession). Have Worked Relatively Poorly Financially: Medicaid — Has operated at an average annual loss of $160 billion with, in effect, an average net margin of -100% over past 15 years; the annual dollar loss has risen from $108 billion to $273 billion because of rising healthcare costs and expanded enrollment. Medicare — Has operated at an average annual loss of $123 billion with, in effect, an average net margin of -83% over past 15 years; the margin has fallen from -66% to -154% (or -$64 billion in annual loss to -$272 billion) because of rising healthcare costs + expanding coverage (added Part D prescription drug benefits through legislation in 2003, rolled out in 2006). P Source: White House Office of Management and Budget. a USA Inc. | Income Statement Drilldown 78 HOUSE_OVERSIGHT_020880
Sponsored
Page 58 - HOUSE_OVERSIGHT_020881
Entitlement Spending: What The Programs Are and How They Have Evolved | Social Security Act signed into law by President Roosevelt. Created during the Medicare Part D signed Medicare cash height of the Great Depression, the Act into law to provide flow (incl. Trust provides monetary support to retired federal subsidies to Fund interest) people from payroll taxes paid by current prescription drugs for turned negative workers and employers. Medicare beneficiaries. (-$5 billion). Social Security Trust Fund Social Security Trust Fund cash flow = $766 million. balance started to decline. Unemployment Insurance signed into law as part of the Social Security Act, Amendments to Social Security setting up a joint federal- Social Security Act cash flow (ex. state program (funded via raising taxes to Trust Fund taxing employers) to shore up funding interest) provide temporary Medicare & Medicaid for the Social projected to monetary support to laid- created to provide Security Trust turn negative by off workers. hospital & medical Fund. Congressional insurance to elderly Budget Office. & disabled. KP Source: Social Security Administration, Dept. of Health & Human Services. (@E www.kpcb.com USA Inc. | Income Statement Drilldown 79 Entitlement Spending: 76% Is Directed to Social Security + Medicare + Medicaid Dedicated Entitlement Revenue Entitlement Spending Breakdown, Breakdown, F2010 F2010 Total = $0.87T Total = $1.98T Other Housing Assistance a ol Other — nsurance 00 utrition 5% Assistance Medicare Unemployment 21% Benefits 8% KP Note: USA federal fiscal year ends in September; Source: White House Office of Management and Budget. (@ www.kpcb.com USA Inc. | Income Statement Drilldown 80 HOUSE_OVERSIGHT_020881
Page 59 - HOUSE_OVERSIGHT_020882
Entitlement Spending: Observations from Previous Slide e Entitlement revenue was $0.87 trillion, yet entitlement spending was $1.98 trillion in F2010. e Entitlement spending exceeded entitlement revenue by 129% in F2010. e Social Security (ex. Trust Fund interest income) accounted for 73% of dedicated entitlement revenue yet only 36% of entitlement spending in F2010 while Medicare accounted for 21% of revenue and 23% of spending and Medicaid accounted for 0% of revenue and 14% of spending. KP i USA Inc. | Income Statement Drilldown 81 Entitlement Spending: Clarification On ‘Unfunded’ / ‘Net Responsibilities’... There is debate about the semantics of using words like unfunded / net responsibilities to describe the financial status of entitlement programs like Social Security, Medicare and Medicaid. ‘Unfunded’ — We define ‘unfunded’ liabilities for Social Security and Medicare as the present value of future expenditures in excess of dedicated future revenue. We call Social Security and Medicare ‘partially unfunded’ entitlement programs as their future expenditures are projected to exceed dedicated future revenue. e ‘Net Responsibilities’ — USA Inc. does not record these ‘unfunded’ financial commitments as explicit liabilities on balance sheet, owing to Federal accounting standards." — USA Inc.’s Dept. of Treasury calls these commitments ‘net responsibilities’ or ‘net expenditures’ in its annual Financial Report of the U.S. Government. e Medicaid — We view Medicaid as an ‘unfunded’ liability as there is no dedicated revenue source to match expected expenses in our financial analysis. Medicaid is jointly funded on a pay-as-you go basis by Federal and State general tax revenue. P Note: 1) per Dept. of Treasury, “2004 Financial Report of the United States Government.” (@E) www.kpcb.com USA Inc. | Income Statement Drilldown 82 HOUSE_OVERSIGHT_020882
Page 60 - HOUSE_OVERSIGHT_020883
...Entitlement Spending: Clarification On ‘Unfunded’ / ‘Net Responsibilities’ e Unless they are reduced, USA Inc.’s financial liabilities -- whether they are actual debt or the present value of future promises, whether called ‘unfunded’ liabilities or ‘net responsibilities’ and whether funded by dedicated taxes or general revenue — represent significant claims on USA Inc.’s future economic resources. e To be sure, the projected unfunded liabilities are not the same as debt, because Congress can change the laws that are behind those future promises. With a few exceptions, however, over the past 60 years, lawmakers have acted to boost rather than reduce them. KP i USA Inc. | Income Statement Drilldown 83 Entitlement Spending: Social Security Funding Has Worked, So Far While Medicare/Medicaid Are Underfunded by $5.6 Trillion Since Inception in 1965 Annual Real Net Income of Social Security / Medicare / Medicaid, 1940 — 2009 Social Security Reform of 1983 Raised taxes by 2.3% Reduced benefits by 5% $100 ——— Social Security ——Medicare (Part A/ B/D) $150 -— se a a ae sles ~~ Medicaid : -$200 ----------------------------------------------------- (Pre Dru g-----------\!-. 1940 1945 1950 1955 1960 1965 1970 1975 1980 1985 1990 1995 2000 2005 Note: Real net income are inflation-adjusted using White House OMB’s GDP price index (based on BEA’s data); calculated as total revenue (tax receipts, excluding trust fund interest revenue) minus total expenditures; Medicare Part B / D and Medicaid do not have dedicated funding source. Source: Social KP Security Administration, White House Office of Management and Budget. (@E) www.kpcb.com USA Inc. | Income Statement Drilldown 84 Annual Net Income of Social Security / Medicare / Medicaid ($B) a ol oO HOUSE_OVERSIGHT_020883
Sponsored
Page 61 - HOUSE_OVERSIGHT_020884
Entitlement Spending: Medicare & Medicaid Payments per Beneficiary Have Risen Faster than Social Security Payments Owing to Rising Healthcare Costs + Expanded Coverage Percent Change in Real* Annual Social Security / Medicare / Medicaid 1966-2009 Payments per Beneficiary From 1966 CAGR 2500% ~~ Medicaid Q, ems i ee ig, sere Kae we EE ee ee eS eee ee oe es eee eee = ee eee ee — wee a ANNs = Social Security @ —— Medicare o o 100% fn £ v D < B VOO0% ac seme <r ee ee ee me ee oe eo eB se ce ee gS Ge =o = rs) x Note: Data are inflation adjusted using White House OMB’s GDP price index (based on BEA’s data). KP Source: Social Security Administration, Dept. of Health & Human Services. (@)E) www.kpcb.com USA Inc. | Income Statement Drilldown 85 0% 1966 1970 1974 1978 1982 1986 1990 1994 1998 2002 2006 Entitlement Spending: Program Beneficiaries (Now 29%* of Population vs. 13%* in 1966) Have Grown Faster than Population Owing to Aging Population + Expanded Eligibility Social Security / Medicare / Medicaid Enrollment & as % of Total Population, 1966 - 2009 160 --- mm SocialSecurity. nn 40% mam Medicare 140, 0 mm Medicaid 1 ——% of Total Population* 97) | 30% Total Enrollment (MM) As % of Population MOQ - -- ~~ -- = += 22 eee eee ee ee ee eee BO «ono -- eg 41 20% 60 - rE | | Ml | : 0% 1966 1970 1974 1978 1982 1986 1990 1994 1998 2002 2006 Note: *Excludes our estimated dual / triple enrollees in Social Security / Medicare / Medicaid. Source: Social Security K P Administration, Dept. of Health & Human Services. (@E) www.kpcb.com USA Inc. | Income Statement Drilldown 86 HOUSE_OVERSIGHT_020884
Page 62 - HOUSE_OVERSIGHT_020885
Entitlement Spending: While Beneficiaries From Aging Population Rose 2x From 1966 to 2009, Beneficiaries From Expanded Eligibility (Low-Income / Disabled) Rose 10x Combined Social Security + Medicare + Medicaid Enrollment by Old Age Group vs. Expanded Eligibility Group, 1966 - 2009 mas Expanded Eligibility (Low Income / Disabled) 140 --- MmmOldAge nn nee en ee ee ee e+ -G ——¥% of Total Population aa! > + Ue 30% aaa anf | i | 20% 60 : t 7 | | Hi - o } 10% 0 T T T 0% 1966 1970 1974 1978 1982 1986 1990 1994 1998 2002 2006 Total Enrollment (MM) o oO As % of Population p oO N o Note: *Excludes our estimated dual / triple enrollees in Social Security / Medicare / Medicaid. Source: Social Security K P Administration, Dept. of Health & Human Services. (@)E) www.kpcb.com USA Inc. | Income Statement Drilldown 87 Entitlement Spending: Entitlement Program + Government Employee Beneficiaries Are Now 36%* of Population vs. 20%* in 1966 Social Security / Medicare / Medicaid Enrollment + Government Employees & as % of Total Population, 1966 - 2009 e 35% By BIR = ee me ee ee ag ae 9 mae oe — eo os oe — gg I os a 2 > Seca } ES 30% = @ eo 5 iT 25% = e120 0 fn + + 8 vé 20% 2 o 2 - 26 80 --------=- -a- L 2 ‘5S 15% 3 . ? “a o + ci 22 10% 3s 40 | ia ' ' 23 2 5% a T T T T T T T T T T T T T T T T T T T T T T T T T T T T T T T 0% 1966 1970 1974 1978 1982 1986 1990 1994 1998 2002 2006 mm Medicaid mmm Medicare “am Social Security mas Federal Government (ex. Military) =a Military mam State & Local Government ——% of Total Population* Note: *Excludes our estimated dual / triple enrollees in Social Security / Medicare / Medicaid. Source: Social Security K P Administration, Dept. of Health & Human Services, Bureau of Economic Analysis. (@E) www.kpcb.com USA Inc. | Income Statement Drilldown 88 HOUSE_OVERSIGHT_020885
Page 63 - HOUSE_OVERSIGHT_020886
Entitlement Spending per Beneficiary: Inflation-Adjusted Average Pre-Tax Income from Entitlement Programs Has Gone Up 3x Since 1966 to $12K in 2008, or 15% of Average Pre-Tax Income Inflation-Adjusted Pre-Tax Income from Entitlement Programs’ per Beneficiary & As % of Average Pre-Tax Income, 1966 - 2008 $14,000 16% $12,000 - - - ---- === eee ee py --_ 14% $10,000 ---------------..------5A- \e ef --- eo ae anil $4,000 i i $2,000 F 7 $0 TT T T T T 0% 1966 1969 1972 1975 1978 1981 1984 1987 1990 1993 1996 1999 2002 2005 2008 8% Income 6% 4% Annual Pre-Tax Income from Entitlement Programs per Beneficiary ($ / year) 2% Entitlement Income as % of Average Pre-Tax am Average Pre-Tax Income from Entitlement Programs ——As % of Total Pre-Tax Income Note: 1) Entitlement income calculated as Government Social Benefits to persons less Veterans benefits. KP Source: Social Security Administration, Dept. of Health & Human Services, Bureau of Economic Analysis. (@)E) www.kpcb.com USA Inc. | Income Statement Drilldown 89 Entitlement Spending: Rising Entitlement Income Is Highly Correlated (82%) with Falling Personal Savings Personal Savings vs. Entitlement! Income as % of Average Disposable Income, 1970 - 2010 — Savings as % of Average Disposable Income 20% ~- ——Entitlement/ Welfare Income as % of Average Disposable Income ----------— ssf 1970 - 2010 Correlation: -82% Entitlement Income / Personal Savings as % of Disposable Income N = Qt tt 1970 1975 1980 1985 1990 1995 2000 2005 2010 Note: 1) Entitlement income calculated as Government social benefits to persons in the NIPA series Table 2.1. Savings rate is the amount of money saved divided by income after taxes. P Sources: BEA (@E) www.kpcb.com USA Inc. | Income Statement Drilldown 90 HOUSE_OVERSIGHT_020886
Sponsored
Page 64 - HOUSE_OVERSIGHT_020887
Entitlement Spending: Observation from Previous Slide e Clearly, lower interest rates have allowed Americans to borrow more and save less. But given the high correlation between rising entitlement income for beneficiaries and declining savings rates, one might also wonder if Americans feel less compelled to save money as they feel that they can depend on the government to give them money. Note: Savings rate is the amount of money saved divided by income after taxes. KP i USA Inc. | Income Statement Drilldown 91 Entitlement Spending: Social Security Now Provides 37% of an Average Retiree’s Income, Up From 31% in 1962 Sources of Retirement Income for Average Americans, 1962 - 2008 ——— Personal Earnings* —— Social Security ——Pensions + IRAs + 401 (k)s** % Total Pension 0% . T T T T T T T T T T T T T T T 1962 1968 1974 1980 1986 1992 2004 Note: *Personal earnings include income from investment & assets + salaries; ** occupational pensions include regular payments from private pensions, government employee pensions, IRAs, 401(k)s. Source: Social Security Administration Office of Retirement and Disability Policy KP www.kpcb.com USA Inc. | Income Statement Drilldown oO N HOUSE_OVERSIGHT_020887
Page 65 - HOUSE_OVERSIGHT_020888
Next, We Drill Down on Entitlement Programs... ¢ We begin with the programs with the least sound financials (Medicaid and Medicare) and end with the programs with the most sound financials (Unemployment Insurance and Social Security), as of today. ¢ We then move to a drilldown of rising healthcare costs after the Medicaid and Medicare drilldowns. KP i USA Inc. | Income Statement Drilldown 93 Rising Debt Periodic Large Level & Interest One-Time Payments Charges Entitlement Spending Note: *denotes F2010 net income / net loss of respective programs, data per White House OMB. 1) Medicare and Social Security net loss excludes Trust Fund interest income. 2) TARP net loss includes proceeds from sale of warrants. TARP is Troubled Asset Relief Program; ARRA KP is American Recovery & Reinvestment Act programs. (@E) www.kpcb.com USA Inc. | Income Statement Drilldown 94 HOUSE_OVERSIGHT_020888
Page 66 - HOUSE_OVERSIGHT_020889
Medicaid: Facing Accelerating Cash Flow Deficits e Social Welfare Program — Created in 1965 to provide health insurance to low-income population (2% of Americans under coverage then and 16% now’). e No Dedicated Funding — Federal funding comes from general revenue (all forms of tax receipts). e Ever-Growing Expenses — $273 billion in F2010, up 2x from 10 years ago. e Rising Healthcare Costs — Owing to aging population + unhealthy life styles + technology advances. e Growing Beneficiary + Benefits — Covered beneficiaries expanded beyond low- income group in 1980s to include additional groups (like individuals who have high medical expenses and have spent down their assets, and some of those who lost their employer-sponsored healthcare insurance coverage in recession), while covered benefits expanded to include prescription drugs / dental services. Total expenditures on these new groups and benefits represented ~60% of Medicaid program’s spending in 2001, per Kaiser Family Foundation estimates. See slide 319-322 for more details. e Moral Hazard — As a “free good,” Medicaid reduced demand for private long-term insurance’ while regulation loopholes + need-based benefit policies created incentives to abuse the Medicaid reimbursement system. Note: 1) for more information, please see Jeffrey Brown and Amy Finkelstein, “The Interaction of Public and Private Insurance: Medicaid and the Long-Term Care Insurance Market,” 2006. *Medicaid enrollment was 4MM (population 196MM) in 1966 and 50MM (population 305MM) in 2009. Source: National Center K P for Health Statistics, Kaiser Family Foundation, World Bank, Social Security Administration. (@)E) www.kpcb.com USA Inc. | Income Statement Drilldown 95 Medicaid: Underfunded by $3.7 Trillion Over 45 Years, With No Dedicated Funding USA Federal Real Medicaid Expenses & NPV of Liabilities, F1966 — F2010 $0 eTTTTTTTTTTNT iL LEE Ls LL Uo LD LU $B5O) ses ~ cee mens aOR eg per @ 2 cae ment mat so a ee eee cae 5 Tt + SEtitkt $100 --------------- +--+ 5 5 SS 4 tt i Seti ‘8 Real Medicaid Expenses $150 -—— RR Sail ——Net Present Value of Medicaid Liabilities -$10 rj & _~ “” oO 2 & 2 £ % ° = 2 $15 3 4g @ @ 2 =a zo} 2 - $20 3 GO wo a = $25 & i. Se a a Ps $30 3 2 a RDI me es es ee es = aes es ts es = =e ge = = $35 2 YEG ms = os es mes es a oe 5 ee ee cs a ea SS a = ss = -$40 1966 1970 1974 1978 1982 1986 1990 1994 1998 2002 2006 2010 Note: USA federal fiscal year ends in September; Data are inflation adjusted. Calculation of net present value of liability based on 75-year Medicaid spending projections from CBO, assuming a 3% discount rate (long-run average of real 10-yr treasury yields). Source: White House Office of Management and Budget, KP Congressional Budget Office. (@E) www.kpcb.com USA Inc. | Income Statement Drilldown 96 HOUSE_OVERSIGHT_020889
Sponsored
Page 67 - HOUSE_OVERSIGHT_020890
Medicaid: Enrollment Is Up 12x to 49 Million While Annual Payments per Beneficiary Are Up 4x to $5K From 1966 to 2009 Real Annual Medicaid Payments per Beneficiary & Enrollment, 1966 - 2009 EE wm mw me ms te cn i en en hs = = 50 $4,500 ---- mm Enrolment: @ = er ene an an a Te ener enw anreny, g $4,000 —— Annual Benefits per Enrollee 40 = S BBSDG <<: 2ccc come screen ne mens an ee metas ns me =o emg mon on md a) = = & $3,000 --------------- +--+ 2-2-2222 ee eee eee eee fee Ltt 30 5 — -— v = BEE mm = m= me mm me io me ma — ee me no te me co oli Htthitth g i] = 3 ° @ BEBE <<< <== es me a ae as sou huaaeaigveann 20 = 7) wi SB PASOQ <—---—y Ttrk TELA EFA AE £ o & $1,000 \. 7 TAHA HALAL 10 wn a TAHA AAPA $0 | T T T T ae T T T T T T T T T T T aa T T T T T T 0 1966 1970 1974 1978 1982 1986 1990 1994 1998 2002 2006 Note: Data are inflation adjusted. Source: Dept. of Health & Human Services. i USA Inc. | Income Statement Drilldown 97 Medicaid: Observations e 49 million (26MM low-income children / 12MM low-income adults /7MM disabled / 4MM elderly) Americans (16% of population) received an average of $4,684 in tax-payer funded payments from the federal government for healthcare in 2009. For context, $6,872 in healthcare benefits is 13% of average annual per-capita income for Americans. e When Medicaid was created in 1965 to provide health insurance to low- income Americans, 1 in 50 Americans received Medicaid, now 1 in 6 Americans receives Medicaid. e That said, Medicaid is an important benefit for recipients as it provides access to healthcare for low-income adults and their children. In recent years, Medicaid beneficiaries and benefit payments have risen faster than population and per-capita income growth owing to expanded coverage, economic difficulties and associated sluggish wage growth for low- and lower-middle-income families, and continued healthcare cost inflation. KP Note: Data are inflation adjusted. Source: Dept. of Health & Human Services. a USA Inc. | Income Statement Drilldown 98 HOUSE_OVERSIGHT_020890
Page 68 - HOUSE_OVERSIGHT_020891
Medicaid: While We Focus on Federal Government Dynamics, It’s Notable that State Government Medicaid Funding Also Faces Significant Challenges e Medicaid = Major and Growing Expense Line Item for State Governments - Medicaid funding responsibility is shared between federal & state governments. States with higher per-capita income (like New York) pay ~50% of total Medicaid cost while states with lower per-capita income (like Mississippi) pay ~22%. - Onaverage, Medicaid accounted for 21% of total state spending in F2009 (ranging from Missouri at 35% to Alaska at 8%). Enrollment growth has been accelerating, in part, owing to more people losing employer-sponsored health insurance in the recession, and thus overall Medicaid costs jumped ~11% Y/Y from October, 2009 to June, 2010. - State governments (which unlike the federal government must balance their annual budgets) cannot pay for such elevated levels of Medicaid and maintain normal spending levels for other services (like education and public safety). e Enter the Federal Government - ARRA (2009 economic stimulus) provided ~$100 billion in support for the states to pay for elevated levels of Medicaid costs and to avoid large budget cuts in education and public safety. This went a long way toward holding down the states’ contribution, but it is a one-time unsustainable fix. e Federal Support May Be Expiring by June, 2011 - Ifno action is taken, the Medicaid-related cost burden on the states will rise dramatically in coming years. As aresult, many states are on the verge of implementing Medicaid cost containment plans that include cuts in doctor payments, benefit limitations, higher patient co-payments, etc. Moreover, many states are fearful that the recently enacted healthcare reform will lead to additional Medicaid- related costs when it goes into full effect in 2014. KP Data Source: National Conference of State Legislatures, “State Budget Update: July 2009.” (@)E) www.kpcb.com USA Inc. | Income Statement Drilldown 99 Rising Debt Periodic Large , Level & Interest One-Time Spend pend Payments Charges Entitlement Note: *denotes F2010 net income / net loss of respective programs, data per White House OMB. 1) Medicare and Social Security net loss excludes Trust Fund interest income. 2) TARP net loss includes proceeds from sale of warrants. TARP is Troubled Asset Relief Program; ARRA KP is American Recovery & Reinvestment Act programs. (@E) www.kpcb.com USA Inc. | Income Statement Drilldown 100 HOUSE_OVERSIGHT_020891
Page 69 - HOUSE_OVERSIGHT_020892
Medicare: Complex Social Insurance Program With Insufficient Funding e Social Insurance Program — Created in 1965 to provide health insurance to the elderly (65+). e Four Parts — A) Hospital Insurance (to cover inpatient expenses, introduced in 1965); B) Medical Insurance (optional outpatient expenses, 1965); C) Medicare Advantage Plans (private alternative to A&B, 1997) and D) Prescription Drug Coverage (enacted 2003). e Funding Mechanism Varies — Part A has dedicated funding via payroll taxes (2.9% of total payroll), though has been running at an annual deficit since 2008 as related payments exceed taxes; Trust Fund is expected to be depleted by 2017E, per Social Security Administration. — Part B &D has no dedicated funding (75% of funding came from government allocation / 25% came from enrollees’ premium payments). — Part C funding came Part A & Part B. e Ever-Growing Expenses — $452 billion expenses in F2010, up 2x from 10 years ago — Rising Healthcare Costs — Owing to aging population + unhealthy life styles + technology advances. — Moral Hazard — As a “free good,” Medicare reduced demand for private long-term insurance’ while loopholes in the regulations + need-based benefit policies created incentives to abuse the system. Note: 1) for more information, please see Jeffrey Brown and Amy Finkelstein, “The Interaction of Public and Private Insurance: Medicaid and the Long-Term Ke Care Insurance Market,” 2006. Source: National Center for Health Statistics, Kaiser Family Foundation, World Bank, Social Security Administration. CB www.kpcb.com USA Inc. | Income Statement Drilldown 101 Medicare: Underfunded by $1.9 Trillion Over 45 Years USA Inc. Real Annual Medicare Revenue & Expenses, 1966 — 2009 mi Medicare Part B / D Expenditure -$300 -- mam Medicare PartAExpenditure = ~~~ ~~~...) Medicare Revenue / Expenses ($B) 2 o Oo ‘am Medicare Part A Tax Receipts —Total Medicare Net Income 1966 1970 1974 1978 1982 1986 1990 1994 1998 2002 2006 Note: Medicare Part A (hospital insurance) has dedicated trust fund while Part B (medical insurance) and Part D (prescription KP drug benefits) do not have dedicated funding. Data are inflation adjusted. Source: Dept. of Health & Human Services.. (@E) www.kpcb.com USA Inc. | Income Statement Drilldown 102 HOUSE_OVERSIGHT_020892
Sponsored
Page 70 - HOUSE_OVERSIGHT_020893
Medicare: Enrollment Up 2x to 46 Million While Annual Payments per Beneficiary Up 26x to $8,325 From 1966 to 2009 Real Annual Medicare Payments per Beneficiary & Enrollment, 1966 — 2009 Em = m= me mm mo me mi i = eS =H = et 50 S ge Enrollment —— Annual Per Cap Benefits (in 2005 dollars) = eee eT Ty Ti Titi 4 2 s =] 3 = eh) ao 30 5 a -_ < o a E 2 ° & $4,000 —~— 1 - 20 = e uw > te) a & $200 PITT i 10 o 3 a $0 T T T T T T T T T T T T T T T T T T T T T T T T T T T T T T T T T T T T 0 1966 1970 1974 1978 1982 1986 1990 1994 1998 2002 2006 KP Note: Data are inflation adjusted using BEA’s GDP price index. Source: Dept. of Health & Human Services. i USA Inc. | Income Statement Drilldown 103 Medicare: Observations e 46 million elderly Americans (15% of population) received an average of $8,325 in tax-payer funded payments for healthcare in 2009 ($5,079 for hospital care; $3,246 for medical insurance & prescription drugs). e On the surface, $8,325 in free healthcare benefits every year certainly seems like a high number — 23% of annual per-capita income — (although working Medicare recipients do pay Medicare taxes). e As with employer-sponsored health insurance plans, if people, in effect, get a free benefit (with little personal financial commitment), they may not be especially diligent and frugal about how they ‘spend’ it. The same concept extends beyond healthcare recipients to the healthcare providers.* e When Medicare was created in 1965 to provide health insurance to elderly Americans, 1 in 10 Americans received Medicare, now 1 in 7 Americans receives Medicare...above the initial ‘plan.’ Note: *The issue that people overuse services for which they do not have personal financial commitment applies to most private insurance as well. For a more detailed discussion, see slide 293. Data are inflation adjusted using BEA’s GDP price KP index. Source: Dept. of Health & Human Services. a USA Inc. | Income Statement Drilldown 104 HOUSE_OVERSIGHT_020893
Page 71 - HOUSE_OVERSIGHT_020894
Total Government* Healthcare Spending Increases are Staggering — Up 7x as % of GDP Over Five Decades vs. Education Spending, Only Up 0.6x USA Total Government Healthcare vs. Education Spending as % of GDP, 1960 — 2009 Spending as % of GDP ——Total Government (Federal + State + Local) Spending on Healthcare \ ’ ——Total Government (Federal + State + Local) Spending on Education 0% oT 1960 1964 1968 1972 1976 1980 1984 1988 1992 1996 2000 2004 2008 Note: *Total government spending on healthcare includes Medicare, Medicaid and other programs such as federal employee and veteran health benefits; total government spending on education includes spending on pre-primary through KP tertiary education programs. Source: Dept. of Education, Dept. of Health & Human Services. www.kpcb.com USA Inc. | Income Statement Drilldown 105 Since Their Creation in 1965, Medicare + Medicaid Have Grown to 35% of Total USA, Inc. Healthcare Spending in 2008 from 0% USA Total Healthcare Spending by Funding Source, 1960 vs. 2009 1960 2009 Total Healthcare Total Healthcare Spending = $187B* Spending = $2.5T* Other Private Funds Consumer Out-of-pocket. ther Government Payments. Funds** Other Private Funds Consumer Out-of-pocket Payments edicaid (Federal + State + Local) Private Health Insurance Private Health Insurance Other Government Funds** Note: *Adjusted for inflation, in 2005 dollars. ** Other government funds include those from Dept. of Defense, Veterans’ Administration and federal funding P for healthcare research and public health activities. Source: U.S. Department of Health & Human Services. (@E) www.kpcb.com USA Inc. | Income Statement Drilldown 106 HOUSE_OVERSIGHT_020894
Page 72 - HOUSE_OVERSIGHT_020895
Think About That... e Total government spending on healthcare (including Medicare, Medicaid and other programs) has risen 7x from 1.2% of GDP in 1960 to 8.2% in 2009 while total government spending on education has risen only 0.6x from 4% of GDP in 1960 to 6% in 2009. e Medicare and Medicaid, which did not exist in 1960, rose to 35% of total healthcare spending in 2009, while out-of-pocket spending declined to 12% of total healthcare spending in 2009 (or $894 per person per year*), down from 47% in 1960 (or $478 per person’). e Lifetime healthcare costs for the average American are $631,000, of which the government pays for an estimated 48% while private insurers (like UnitedHealth and Blue Cross Blue Shield) pay 32% and consumers pay just 12%. e When citizens don’t need to pay directly for something (like healthcare) and are given an expensive good / service for free (or well below cost), they tend to consume more of it — it’s basic supply and demand economics. e This approach faces increasing challenges as USA, Inc. has gone deeper and deeper in debt to pay for it... Note: *Adjusted for inflation, in 2005 dollars. Nominal amount would be $972 out-of-pocket healthcare spending per person in KP 2008 and $70 per person in 1960. Source: U.S. Department of Health & Human Services. www.kpcb.com USA Inc. | Income Statement Drilldown 107 USA Healthcare Spending Is Higher Than All Other OECD Countries Combined (with 35% of Other OECD Countries’ Combined Population) a Public a Private — jaa & 1°) = xo} i= o 2. n = = i] o <= 3 -_ ° Ee Mexico rr) cs) ox DS @ DAH BG ic >X ome VPPLVEP SCL EFSSSEvpEeErTyssS SSEORDUES = i sas ao S55 & Dg —] Saéxee aot :@ 8 <¢ee SsL2e G8 8B FSP9GDHGEEREC EO RISiag FH 3 sE& 955 D 5.0 5 on cS SE a eG 5nGC PLCfCRBEGESE = 0 ne O:'N & i 5 2) SO ET SE G5Sq00 FL 9 Gar SY >: § Le ~ Ean Tray a £4 =< We fo) xx“ 3 < = ro) :O: 36 & @ 77) z 70; o sz o rWW: 2 8 'O: ” Perry Note: OECD data adjusted for Purchasing Power Parity. *Total expenditure on health measures the final consumption of health goods and services (i.e., current health expenditure) plus capital investment in healthcare infrastructure. This includes spending by both public and private sources (including households) on medical services and goods, public health and prevention programs, and administration. Excluded are health-related expenditures such as training, research, and environmental health. Source: OECD, Organization for Economic Co-operation and Development is an international organization of 31 developed and emerging P countries with a shared commitment to democracy and the market economy. (@E) www.kpcb.com USA Inc. | Income Statement Drilldown 108 HOUSE_OVERSIGHT_020895
Sponsored
Page 73 - HOUSE_OVERSIGHT_020896
USA Per Capita Spending on Healthcare = 3x OECD Average Annual Per Capita Expenditure* on Health Among OECD Countries, 2007 WG00D - — - mn 3 a a = Public @ Private Annual Per Capita Health Spending ($) PF Ay o oS So | | | | | | | | | | | | | | $0 Korea Japan Greece UK lreland Belgium Turkey Czech Republic Mexico Poland Hungary Slovak Republic Portugal New Zealand OECD average Finland Iceland Sweden Australia Denmark Netherlands Germany France Austria Canada Switzerland Norway Luxembourg Note: OECD data adjusted for Purchasing Power Parity. *Total expenditure on health measures the final consumption of health goods and services (i.e., current health expenditure) plus capital investment in healthcare infrastructure. This includes spending by both public and private sources (including households) on medical services and goods, public health and prevention programs, and administration. Excluded are health-related expenditures such as K Pp training, research, and environmental health. Source: OECD. www.kpcb.com USA Inc. | Income Statement Drilldown 109 USA Spending on Healthcare as % of GDP = 2x OECD Average Total Healthcare Spending as % of GDP Health Among OECD Countries, 2007 MEI ne oe em en oe te o a 5 = Public m Private ro) se 12% --------------------- pM. -------------------- w 7 oa @ : 3 fo7) : 5 £ i ZB 8% -----------o SEL EREDEEPRGPELT EEF o l a [os i id 7) tae i a i = ‘a: s 4% OE SUTTER i a: ~~ i ° i: E HE 0% t >Aos Te D ox ec OMX @ DOIG yw Hw re} x = S&S > y |< SSSPEPTCL SEES Eo eSRESEsSEESSEF? Bla ERXSSeeZ aS FoR QHemissczanagevg9tlezacun sea Sid SOLVo0h8SealSe wn 10858“ 9GtEDECSETSE FS". ESEO°T : i335 SL2OfSeo § it see ex : it “5 ama Ox 4 ae o S Ss : 5 z i?) —_l : & Note: OECD data adjusted for Purchasing Power Parity. *Total expenditure on health measures the final consumption of health goods and services (i.e., current health expenditure) plus capital investment in healthcare infrastructure. This includes spending by both public and private sources (including households) on medical services and goods, public health and prevention programs, and administration. Excluded are health-related expenditures such as training, research, and KP environmental health. Source: OECD. a USA Inc. | Income Statement Drilldown 110 HOUSE_OVERSIGHT_020896
Page 74 - HOUSE_OVERSIGHT_020897
USA Spending on Healthcare IS NOT Performance-Based and IS NOT Correlated to Longer Life Expectancy Healthcare Spending per capita vs. Average Life Expectancy Among OECD Countries, 2007 BBR a Japan o r) , = oe? oe m g0 ----------------------- @ gO ee i e Eo S. Koreae ra i * g fe ° & -“ * @ a @@ UK __ Linear Trend line (ex. USA) i — USA 2 ie = : im e oy wei RG: = Ge Se SR em ee ee -e e ee e ee ee e - a Mexico e Ho o @ Hungary vo > <t 70 I T T T T T T T 0 1000 2000 3000 4000 5000 6000 7000 Total Expenditure on Health per capita, $US (PPP Adj.) KP Source: OECD. i USA Inc. | Income Statement Drilldown 111 In Addition to Life Expectancy, USA Falls Behind OECD Averages in Many Other Health Indicators OECD USA Ranking 2007 Health Indicators USA Median (1 = Best, 30 = Worst) RED = Below Average Obesity (% of total population) 34 15 30 Infant Mortality (per 1,000 live births) 7 4 27 Medical Resources Available (per 1,000 population) Total Hospital Beds 3 6 25 Practicing Physicians 2 3 22 Doctors’ Consultations per Year 4 6 19 MRI Machines*@ (per million population) 26 9 1 Cause of Death (per 100,000 population) Heart Attack 216 178 22 Respiratory Diseases 60 45 21 Diabetes 20 12 20 Cancer 158 159 14 Stroke 33 45 8 FES skocb.com ree eee Sa na |Ingome Statement Drildown 112 HOUSE_OVERSIGHT_020897
Page 75 - HOUSE_OVERSIGHT_020898
Think About That... e USA per capita healthcare spending is 3x OECD average, yet the average life expectancy and a variety of health indicators in the US fall below average. e But if you spend way more than everyone else, shouldn’t your results (a.k.a. ‘performance’) be better than everyone else’s, or at least near the top? e Should you examine sources of waste/inefficiency given lower output despite greater input? e Definition of ‘Performance’ = Amount of useful work accomplished given certain amount of time and resources. e Definition of ‘Efficient’ = Obtains maximum benefit from a given level of input of cost, time, or effort. Note: OECD data adjusted for Purchasing Power Parity. * Lifetime healthcare costs = life expectancy (years) x per capita KP healthcare spending ($ per year, 2006). Source: OECD, US Dept. of Health & Human Services. (@)E) www.kpcb.com USA Inc. | Income Statement Drilldown 113 Patient Protection and Affordable Care Act (PPACA) PPACA — America’s new healthcare reform legislation, signed into law on 3/23/10 — creates some reason for concern that it could become an unfunded entitlement. KP a USA Inc. | Income Statement Drilldown 114 HOUSE_OVERSIGHT_020898
Sponsored
Page 76 - HOUSE_OVERSIGHT_020899
PPACA: A Detailed Drilldown into Costs of Recent Healthcare Reform Is Key as it May Increase Budget Deficit... e Congressional Budget Office expects Reform to /ower the deficit by $143 billion during 2010-19 - Gross cost of $938 billion for expanded coverage, per CBO. - Less: $511 billion in spending cuts from lower Medicare reimbursement rate + $420 billion in tax revenues (excl. excise tax) from higher payroll tax rates on high-income families and indoor tanning services + $149 billion in penalty payments by employers/individuals and excise tax on “Cadillac” insurance plans with annual cost exceeding $10,000 for individual / $28,000 for families. KP Source: CBO. (@)E) www.kpcb.com USA Inc. | Income Statement Drilldown 115 PPACA — Verdict Is Still Out on Eventual Costs / Deficit Impact e Issues With Official Cost Estimates to Consider - Deficit neutral status somewhat reliant on future lawmakers’ willingness to implement Medicare savings/reimbursement reductions: e Reductions in payment rates for many types of Healthcare providers relative to the rates that would have been paid under prior law (always a politically difficult decision). e However the good news is that recommendations from the Independent Payment Advisory Board focused on reducing growth in per capita Medicare spending if it exceeds target automatically become the law without congressional intervention if Congress allows IPAB to operate as planned. - CBO estimates the effects of proposals as written: CBO acknowledges that it is unclear whether reform can actually reduce the annual growth rate in Medicare spending from 4% (historical average) to 2% for the next two decades, as PPACA estimates assume. - Relies on excise taxes on sectors of the healthcare industry that could be passed through to consumers via price increases. - Starting in 2018, assumes taxation of high premium employment-based health insurance plans. e Opportunities For Cost Savings to Consider - Increased access to preventative care could potentially slow down overall healthcare cost growth. Such potential effect is not captured in CBO scoring. - Investments in information technology and new provider & consumer incentives can drive better and more efficient care. KP Source: Morgan Stanley Healthcare Research. a USA Inc. | Income Statement Drilldown 116 HOUSE_OVERSIGHT_020899
Page 77 - HOUSE_OVERSIGHT_020900
PPACA — There Is Potential for ‘Unintended’ Consequences e The new law changes some system incentives, which may lead to new behavior patterns, many of which are complex and hard to predict. — The market may adapt to new MLR (Medical Loss Ratio) rules that incentivize and reward a very specific (but ultimately arbitrary) cost structure. — The cost/benefit analysis for employers and consumers may change, and some may opt to re-evaluate their current employer-sponsored coverage offerings. e Health plans that are no longer economically viable may exit markets, potentially adding to the uninsured problem prior to 2014. e Likely acceleration in consolidation of payers as well as providers. Source: Doug Simpson, Morgan Stanley Healthcare Research. (@)E) www.kpcb.com USA Inc. | Income Statement Drilldown 117 Historical Anecdote — “An Accurate Economic Forecast Might Have Sunk Medicare & Medicaid [in 1965]” * In 1965, the official estimate of Medicare’s costs was $500 million per year, roughly $3 billion in 2005 dollars.* * The actual cost of Medicare has turned out to be 10x that estimate. - Medicare’s actual net loss (tax receipts + trust fund interest — expenditures) has exceeded $3 billion (adjusted for inflation) every year since 1976 and was $146 billion in 2008 alone. In other words, had the original estimate been accurate, the cumulative 43-year cost since Medicare was created would have been $129 billion, adjusted for inflation. - Infact, the actual cumulative spending has been $1.4 trillion** (adjusted for inflation)...in effect, 10x over budget. * While calculations have been flawed from the beginning for some of USA Inc.’s entitlement programs, little has been done to correct the problems. An accurate economic forecast might have sunk Medicare. David Blumenthal and James Morone “The Lessons of Success — Revisiting the Medicare Story”, November 2008 Sources: * Lyndon B. Johnson Library & Museum. Medicare spending data per White House OMB. KP “Dept. of Health & Human Services, CMS, data adjusted for inflation based on BEA’s GDP price index. (@E) www.kpcb.com USA Inc. | Income Statement Drilldown 118 HOUSE_OVERSIGHT_020900
Page 78 - HOUSE_OVERSIGHT_020901
If History is a Guide, There is Potential for Estimates to Understate Eventual Costs — Medicare Is 10x Higher Than Spending Forecast Actual vs. Estimated Spending on Medicare In reality, total 420 spending increased 61.1x — Re} 100 2) J zs @ = QQ = - se so oe se we oe ee eee ee = In 1967, the House 2 A In the first year of Ways & Means 2 60 Medicare, total Committee estimated = a= spending was spending would ov . Sag $1.8bn increase 6.7x by 1990 2 ov = E c 20 ----- +r rrr rrr rrr rrr re ii SE nt na at nom Hum! - ee oe £ ¢ $12B < SL ’ $2B ) 1966A 1990E (in 1967) 1990A Source: Senate Joint Economic Committee Report, 7/31/09 i USA Inc. | Income Statement Drilldown 119 However, More Recent Healthcare Entitlement Such as Medicare part D Has Cost Less Than Expected Medicare Part D (the 2006 outpatient drug benefit for seniors) was projected to cost $111 billion annually. e In 2009, Medicare Part D’s actual cost = $61 billion, 45% below projection. e The government originally projected 43 million beneficiaries in 2009, but only 33 million seniors (23% below projection) elected to participate in 2009. Medicare Part D was outsourced to the private sector, and seniors elected to enroll in plans operated primarily by managed care organizations, which utilize a variety of techniques to reduce costs and improve the quality of care. e The Washington Times stated on August 16" 2010 — "The lower cost - a result of slowing demand for prescription drugs, higher use of generic drugs and fewer people signing up - has surprised even some of the law's most pessimistic critics." e The Part D experience has given some observers hope that PPACA will not cost more than anticipated. KP Source: Morgan Stanley Healthcare Research. (@E) www.kpcb.com USA Inc. | Income Statement Drilldown 120 HOUSE_OVERSIGHT_020901
Sponsored
Page 79 - HOUSE_OVERSIGHT_020902
Rising Debt Periodic Large Level & Interest One-Time Payments Charges Entitlement Spending Unemployment Note: *denotes F2010 net income / net loss of respective programs, data per White House OMB. 1) Medicare and Social Security net loss excludes Trust Fund interest income. 2) TARP net loss includes proceeds from sale of warrants. TARP is Troubled Asset Relief Program; ARRA KP is American Recovery & Reinvestment Act programs. (@)E) www.kpcb.com USA Inc. | Income Statement Drilldown 121 Unemployment Benefits: Long-Term Break-Even, Though Prone to Cyclicality Social Insurance Program — Created in 1935 as part of the Social Security Act to provide temporary financial assistance to eligible workers who are unemployed through no fault of their own (via layoffs or natural disasters). e Funded via Taxing Employers — Employers pay federal government 0.8% of payroll (in addition to various levels of state unemployment insurance taxes) to fund the Federal Unemployment Insurance Trust Fund. e Funding = Pro-Cyclical — Rising employment increases revenue and reduces benefit payments, generally leading to surpluses, while falling employment reduces revenue and increases benefits payments, leading to periodically large deficits during recessions. Flexible at the State Level by Design — State governments set policies on unemployment benefit eligibility / duration / tax levels, while federal government provide financial and legal oversight. Generally Break-Even — In 29 of the past 49 years, Federal unemployment insurance programs have had surpluses. Excluding the 2009 / 2010 loss, unemployment insurance had a cumulative surplus of $53 billion from 1962 to 2008. KP Source: White House OMB. (@E) www.kpcb.com USA Inc. | Income Statement Drilldown 122 HOUSE_OVERSIGHT_020902
Page 80 - HOUSE_OVERSIGHT_020903
Unemployment Benefits: Solid, Though Cyclical, Funding But Underfunded by $150B Over 49 Years Owing to -$115B* Deficits in 2010 USA Inc. Real Annual Unemployment Insurance Revenue & Expenses, F1962 — F2010 BZ) ce — rs ne ne ars res ces care et canes cs ee 9 aS Soe ip — fos eS Soe et — pats Ses Ss fk — Fame SD SS FE 2 SS So SSO eS cos et — a o sci ” a =< $20 silttucscel - oT) < AT jf i\ | nonn a wi T T T T T T T i} T T T Ta I W T J T T T T T T iy T T T T T T T T T a = S -$30 ------------------§----NFU-E-- Ug a --------ADFE--------- > a a“ vo [S) F GSO — eae ee = re ee ee i a ore 9 sae mae st — um an ake — GU as Nh — GR a IS mao 9 SE Sat — ” = = a = mass Unemployment Insurance Expenses > @ $130 --- ees i ete me eS YM 2 «ass Unemployment Insurance Revenue a = — Unemployment Insurance Net Income -$180 ~~ - ~~ - a a 1962 1966 1970 1974 1978 1982 1986 1990 1994 1998 2002 2006 2010 Note: USA federal fiscal year ends in September; *all data inflation-adjusted, based on 2005 dollars. KP Source: White House Office of Management and Budget. (@)E) www.kpcb.com USA Inc. | Income Statement Drilldown 123 Unemployment Benefits: In the Past, Benefits Paid Have High (70%) Correlation to Unemployment Rate Real Unemployment Benefits & Unemployment Rates, 1962 — 2010 MD ce 2 = mam ce cw ae i oN ~ T D TB B - 12% mas Real Unemployment Benefits 160 —UnemploymentRate = = — 10% ER BID mmm me me we me me se oe me im = Hm St ie t= te tee — on & BI mmm em — ne me no em me soe me fle er st ee t= ee 8% o 2 co @ $B AID mee me me a ae ee ee ll — a re ae es ln — ee a Ss a St 3 = o < = 6% @ > E B 80 Nf Nf EQ fe Nef = fom — £ a @ E S 60 ----- Qf ge NB 4% @ > 2 g m 40 --------------------- P-gp 2% 20 Th - seo 0 0% 1962 1966 1970 1974 1978 1982 1986 1990 1994 1998 2002 2006 2010 KP Note: Fiscal year ends in September. Source: White House Office of Management & Budget, Bureau of Labor Statistics. a USA Inc. | Income Statement Drilldown 124 HOUSE_OVERSIGHT_020903
Page 81 - HOUSE_OVERSIGHT_020904
Unemployment Benefits: Good News—Unemployment Change In the Past Has Strong (71%) Inverse Correlation with Real GDP Change, so Economic Growth Should Reduce Unemployment Q/Q Unemployment Rate Change & Real GDP Change, CQ1:48 — CQ4:10 20% ~~ 2 nn ee eee ene ne eee 200% Se ee. ee 150% 10% -4-----9----9--------- 2-2-2 pee ee ee eee eee eee 100% l wr MN \ Nha w | Quarterly Unemployment Change Quarterly Real GDP Change (Inverse Scale) 5% | 1 may, Wey | | | 50% 10% jee yo IN | Be 0, 45% --W----------- -100% —— Quarterly Unemployment Rate Change 20% — Quarterly RealGDP Change (Inverse Scale) 150% 1Q48 1Q53 1958 1Q63 1Q68 1Q73 1Q78 1983 1088 1093 1998 1003 1008 K P Source: Bureau of Economic Analysis, Bureau of Labor Statistics. i USA Inc. | Income Statement Drilldown 125 Unemployment Benefits: Bad News—Newly Extended Unemployment Benefits Could Cost USA Inc. $34 Billion in Next Two Years Net Cost of Extended Unemployment Benefits to Federal Government, F2010-2011E $30,000 - ---- ------- +222 ee ne ee ee ne ee ee ne ee eee $25,000 $20,000 $15,000 $10,000 Cost of Extended Unemployment Benefits ($MM) F2010E F2011E Note: Net cost of the Unemployment Compensation Extension Act of 2010 is expected to decline substantially in F20172E because the deadline to file for extended unemployment benefits expires in November 2010 and federal extended KP unemployment insurance provides benefits for up to 99 weeks (less than two years). Source: Congressional Budget Office, 7/10. (@E) www.kpcb.com USA Inc. | Income Statement Drilldown 126 HOUSE_OVERSIGHT_020904
Sponsored
Page 82 - HOUSE_OVERSIGHT_020905
Unemployment Benefits: Bad News—Structural Problems in Labor Force Could Lead to Prolonged Duration/Increased Rate of Unemployment e Structural Problems in USA Labor Force — Healthcare costs may be a barrier to hiring for employers e Healthcare benefits = 8% of average total employee compensation; grew at 6.9% CAGR from 1998 to 2008 compared with 4.5% CAGR in salaries. e Healthcare benefits are fixed costs as they are paid on an annual per-worker basis and do not vary with hours worked. e As employers try to lower fixed costs to right-size to their reduced revenue levels, layoffs are the only way to reduce fixed healthcare costs. — Skills mismatch may be a barrier to hiring for employers e A large portion of the long-term unemployed may lack requisite skills. e 14% of firms reported difficulty filling positions due to the lack of suitable talent, per 5/10 Manpower Research survey. — Labor immobility resulting from the housing bust may be a barrier to hiring e One in four homeowners are “trapped” because they owe more than their houses are worth, so they cannot move to take another job — until they sell or walk away. KP Source: Richard Berner, “Why is US Employment So Weak” (7/23/10), Morgan Stanley Research. (@)E) www.kpcb.com USA Inc. | Income Statement Drilldown 127 Unemployment Benefits: Bad News Although economists have shown that extended availability of UI [unemployment insurance] benefits will increase unemployment duration, the effect in the latest downturn appears quite small compared with other determinants of the unemployment rate. Our analyses suggest that extended UI benefits account for about 0.4 percentage point of the nearly 6 percentage point increase in the national unemployment rate over the past few years. It is not surprising that the disincentive effects of UI would loom small in the midst of the most severe labor market downturn since the Great Depression. Despite the relatively minor influence of extended UI, it is important to note that the 0.4 percentage point increase in the unemployment rate represents about 600,000 potential workers who could become virtually unemployable if their reliance on UI benefits were to continue indefinitely. Rob Valletta and Katherine Kuang, Federal Reserve Board of San Francisco “Extended Unemployment and UI Benefits,” April 19, 2010. P a USA Inc. | Income Statement Drilldown 128 HOUSE_OVERSIGHT_020905
Page 83 - HOUSE_OVERSIGHT_020906
Rising Debt Periodic Large Level & Interest One-Time Payments Charges Entitlement Spending Social Security Note: *denotes F2010 net income / net loss of respective programs, data per White House OMB. 1) Medicare and Social Security net loss excludes Trust Fund interest income. 2) TARP net loss includes proceeds from sale of warrants. TARP is Troubled Asset Relief Program; ARRA KP is American Recovery & Reinvestment Act programs. (@)E) www.kpcb.com USA Inc. | Income Statement Drilldown 129 Social Security: In Good Shape Now, Yet Challenged in Future by Aging Population e Social Insurance Program Created in 1935 — During height of the Great Depression to help elderly (65+*) and disabled people avoid poverty. e Pay-as-You-Go Funding — Social Security taxes deducted from current payrolls to pay out to current eligible recipients of Social Security. e For Most of its 8 Decades (1935-1970; 1985 - 2009), Annual Social Security Payments Have Been Funded by Annual Social Security Taxes — However, based on estimates from Congressional Budget Office (CBO), beginning in 2016 (or earlier), Social Security will begin running an annual deficit as payments exceed taxes (at unchanged flat tax rate of 12.4%' of annual gross wages) — this is a problem! e Social Security Has Been Struck by Annual Deficit Crisis Before — From 1975 to 1981, Social Security expenses exceeded revenue every year, which caused a 45% reduction in the Social Security Trust Fund balance. Legislation recommended by the Greenspan Commission in 1983 reduced average benefits by ~5%? and raised social insurance tax rates for individuals by ~2.3%.? But the Greenspan Commission fix will run out soon as Social Security turns to operating loss in 2016. Note: *Early retirees (62+) could receive partial benefits between 62 and 65. 1) 6.2% taxes paid by employees and matched by employers on gross wages up to but not exceeding the Social Security wage base of ~$100K; 2) total benefit cuts included $27B savings from benefit taxation for the wealthy and $66B savings from delay in cost of living adjustments over 1984-1989; 3) average increase in entitlement payroll tax rates between 1982 and 1988, includes Medicare payroll KP taxes, per estimates from CBO. Source: Social Security Administration. (@E) www.kpcb.com USA Inc. | Income Statement Drilldown 130 HOUSE_OVERSIGHT_020906
Page 84 - HOUSE_OVERSIGHT_020907
Social Security: Financially Sound — So Far — Owing to Increased Revenue / Reduced Spending Post 1983 Reform, But ‘Operating Loss’ Resumed in 2009 Real Social Security Operating Income, 1957 — 2010 BO eee Real Net Income of Social Security Program ($B) 1957 1961 1965 1969 1973 1977 1981 1985 1989 1993 1997 2001 2005 2009 Note: *Data is adjusted for inflation using White House OMB’s GDP price index (based on BEA’s data). KP USA federal fiscal year ends in September; Source: Social Security Administration. (@)E) www.kpcb.com USA Inc. | Income Statement Drilldown 131 Social Security: Enrollment Up 5x to 52 Million While Inflation-Adjusted Annual Payments per Beneficiary Up 2x to $12K From 1957 to 2009 Real Annual Social Security Payments per Beneficiary & Enrollment, 1957 — 2009 BAA ILE — mee em = et ma i = ma i 9 Hs 60 mga Enrollment S $12,000 ------------ —— Annual Per Cap Benefits (in 2005 dollars) = = & E $10,000 . 2 40 — a = ee = a -_— 5 30 @ 5 E 3) GGROO - =~ =~ = ge - = aoe re < oO ¢ £ Ww 5 20 a $4000 | TH @ = ¢ aiid I 10 — $2,000 0 1957 1961 1965 1969 1973 1977 1981 1985 1989 1993 1997 2001 2005 2009 P Note: Data are inflation adjusted using BEA’s GDP price index. Source: Social Security Administration. a USA Inc. | Income Statement Drilldown 132 HOUSE_OVERSIGHT_020907
Sponsored
Page 85 - HOUSE_OVERSIGHT_020908
Social Security: Observations e 52 million retired Americans (17% of population) received an average of $11,826 (in 2005 dollars) in Social Security payments (32% of USA per-capita income) in 2009. e By comparison, 10 million retired Americans (6% of population) received an average of $5,447 (in 2005 dollars) in Social Security payments (51% of per-capita income) in 1957. e When Social Security was created in early 20" century to provide retirement income to elderly Americans, 1 in 127 Americans’ (<1% of population) received Social Security payments. Now 1 in 6 Americans (17%) receive Social Security payments...well above the initial ‘plan.’ Note: 1) Social Security was created in 1935, full data on enrollees not available until 1945. KP Source: Social Security Administration. (@)E) www.kpcb.com USA Inc. | Income Statement Drilldown 133 Social Security: America is Aging, and USA, Inc. Workers Are Required to Support 5x More Beneficiaries (and Rising) than They Did in 1950! 1950 2010 Social Security Social Security Beneficiaries Beneficiaries Supported by Supported by 100 Workers 100 Workers ESA srrnrocb.com USAloelineore Swementiilaown 68 HOUSE_OVERSIGHT_020908
Page 86 - HOUSE_OVERSIGHT_020909
Social Security: Each Retiree Was Supported by 42 Workers in 1945 & Just 3 Workers in 2009 Supporting Workers per Social Security Beneficiary, 1945 — 2030E —> Forecast a eS ee 7) ee Cs ee ? es ee | es oe 10 -------+--\pe eee eee ee eee ee ee ee eee ee ee ee be ee ee eee Supporting Workers per Beneficiary T T T T T T T T T T T T T T T T T T 1945 1955 1965 1975 1985 1995 2005 2015E 2025E KP Source: Social Security Administration. i USA Inc. | Income Statement Drilldown 135 Think About That... lf you are a worker in USA, Inc. (as 81 million tax-paying Americans are), in effect, you have 5 times more ‘dependents” than your parents had and 15 times more than your grandparents. 1 Note: * Dependents’ = retirees who receive Social Security benefits primarily funded via payroll taxes on current working population. ESA sa nerpce.com USA Inc. | Income Statement Drilldown 136 HOUSE_OVERSIGHT_020909
Page 87 - HOUSE_OVERSIGHT_020910
Analysts Often Think of Things as Math Problems... So, how about this one... KP CC —— USA Inc. | Income Statement Drilldown 137 Americans Are Living 26% Longer, But Social Security ‘Retirement Age’ Has Increased Only 3% Since Social Security Was Created in 1935... USA Life Expectancy at Birth, 1935 & 2009 USA Full Retirement Age, 1935 & 2009 USA Life Expectancy at Birth (Years) USA Full Retirement Age (Years) 1935 2009 1935 2009 Note: Full retirement age is 65 for people born in 1930; 67 for people born in 2009; Social Security Amendments of 1961 allowed early retirement to start at | 62+ with reduced benefits. Source: National Center for Health Statistics, World Bank, Social Security Administration. (@ www.kpcb.com USA Inc. | Income Statement Drilldown 138 HOUSE_OVERSIGHT_020910
Sponsored
Page 88 - HOUSE_OVERSIGHT_020911
That’s a Math Problem... e If an expense rises by 26% and the ability to pay rises by only 3%, the math doesn’t work. A computer in a science fiction movie might blurt out, ‘does not compute...does not compute...’ e “Something’s Gotta Give...’ as the 2003 film put it. e A mathematician or economist would say, ‘the expense must go down or the ability to pay must rise to match the expense.’ e Simple math implies that the age for collecting full benefits should rise from 67 to 72, so that expenses more closely match workers’ ability to pay. Under this scenario, while Americans are living 30% longer, the ‘retirement’ age would rise just 7%, still well below the increase in life expectancy since Social Security was created. KP i USA Inc. | Income Statement Drilldown 139 Social Security: Unless The Program Is Restructured, Cash Flow Will Turn Negative by 2015E Owing to Aging Population Real Social Security Annual Operating Income, 1982 — 2036E IRIN mm 0 wr em owe sae oo tse nae t= = fe = ms SN = 8 A = = 2015+ Permanent $100 ~~~ - ~~~ -- = - Negative Cash Flow -------------------- $0 Annual Social Security Net Cash Flow ($B) Oo Oo 1982 1987 1992 1997 2002 2007 2012E 2017E 2022E 2027E 2032E Note: Data adjusted for inflation in real 2009 dollars. Includes Disability Insurance. Projection by Social Security Administration KP in 8/10. Source: Social Security Administration. (@E) www.kpcb.com USA Inc. | Income Statement Drilldown 140 HOUSE_OVERSIGHT_020911
Page 89 - HOUSE_OVERSIGHT_020912
Heretofore, Social Security and Unemployment Insurance have been effectively funded, but two significant entitlement programs (Medicaid and Medicare) were created without effective funding plans / programs. Only one of these (Medicaid) is means-tested (indicating that one is eligible for Medicaid only if he / she does not sufficient financial means). Left unchanged, Unemployment Insurance funding should improve as economic growth resumes, but Social Security will no longer be self-funded within 5-10 years, and the underfunding of Medicaid and Medicare will simply go from bad to worse. KP i USA Inc. | Income Statement Drilldown 141 Drill Down on USA Inc. Rising Debt Level and Interest Payments Rising Debt Periodic Large Level & Interest One-Time Payments Charges Entitlement Spending Note: *denotes F2010 net income / net loss of respective programs, data per White House OMB. 1) Medicare and Social Security net loss excludes Trust Fund interest income. 2) TARP net loss includes proceeds from sale of warrants. TARP is Troubled Asset Relief Program; ARRA is American Recovery & Reinvestment Act programs. www.kpcb.com USA Inc. | Income Statement Drilldown 142 HOUSE_OVERSIGHT_020912
Page 90 - HOUSE_OVERSIGHT_020913
Interest Payments: 3 Determinants = Debt Level + Interest Rates + Maturity Debt Level 4 : > * 62% of GDP in 2010, up 2x over 30 years f Debt y + Projected to rise to ~146% of GDP by 2030E Level | owing to diminishing surpluses from Social ~ 7 Security and rising expenses from Medicaid and Pa —_— other entitlement spending Effective Interest Rates Effective ¢ At historic low of 2.2% in 2010, vs. 30-year Interest average of 6.4% Rates * Will rise with federal funds target rate & long-term Treasury yield as economy recovers Maturity ¢ Shorter debt maturities imply less leverage to Maturity reduce future interest payments via inflation ¢ Long-term debt (10+ year) only 10% of total in 2010, down from 15% in 1985 ¢ Short-term debt (0-1 year) especially large in 2009 P Source: Historical debt level / effective interest rates data per White House OMB; Debt projection per CBO; Maturity and composition per Dept. of Treasury. (@)E) www.kpcb.com USA Inc. | Income Statement Drilldown 143 Drill Down on Debt Levels & Related Expenses We begin with a simple study of current and historical debt levels and key drivers of why debt has risen so much, then we look at interest rates (which are low by historical standards) and the impact they have on interest expense, then we look at the short-term vs. long-term composition of USA Inc.’s debt. KP a USA Inc. | Income Statement Drilldown 144 HOUSE_OVERSIGHT_020913
Sponsored
Page 91 - HOUSE_OVERSIGHT_020914
Entitlement Spending Medicaid (-$273B Net Loss*) Medicare (-$272B Net Loss*") Unemployment Benefits (-$115B Net Loss*) Social Security (-$75B Net Loss*') Rising Debt Level & Interest Payments Effective Interest Rates (2.2%) Debt Composition Periodic Large One-Time Charges TARP ($26B Net Profit*2) Fannie Mae / Freddie Mac (-$41B Net Loss*) ARRA (-$137B Net Loss*) Note: *denotes F2010 net income / net loss of respective programs, data per White House OMB. 1) Medicare and Social Security net loss excludes Trust Fund interest income. 2) TARP net loss includes proceeds from sale of warrants. TARP is Troubled Asset Relief Program; ARRA (@)E) www.kpcb.com is American Recovery & Reinvestment Act programs. USA Inc. | Income Statement Drilldown 145 Debt Level: Highest (as % of GDP) Since World War II and Rising Rapidly USA Federal Debt Held by the Public’ as % of GDP, 1940 — 2010 < World War Il 80% ----| 60% ~~ Public Debt As % of GDP 40% 20% 0% 1940 1946 1952 1964 1970 1976 1982 1994 2000 2006 Note: 1) For a more-detailed discussion about net debt (Federal debt held by the public) vs. gross debt, see slide 455 to 463 in Appendix. Source: White House Office of Management and Budget. (@E) www.kpcb.com USA Inc. | Income Statement Drilldown 146 HOUSE_OVERSIGHT_020914
Page 92 - HOUSE_OVERSIGHT_020915
(@)E) www.kpcb.com Why Has Debt Risen So Much? Public Debt Up 2x Over Past 3 Decades Source: White House Office of Management and Budget. USA Inc. | Income Statement Drilldown 147 Answer Part 1: % Change From 1965 KP 1200% 1000% 800% 600% 400% 200% 0% Debt Level: Why It Has Risen Expenses (Entitlement + One-Time Items*) Grew Faster Than GDP USA Real Federal Expenses vs. Real GDP % Change, 1965 — 2010 Total Expenses Entitlement Programs Non-Defense Discretionary Defense Net Interest Payments —- =Real GDP 1969 1973 1977 1981 1985 1989 1993 1997 2001 2005 2009 Note: *One-time items could not be shown in chart because % change from 1965 is not available. For context, one-time items totaled $377B in 2009 and $152B in 2010 (both in 2005 constant dollars), both of which are the 3” largest line item after entitlement expenses and defense spending. Data adjusted (@E) www.kpcb.com for inflation. Source: White House Office of Management and Budget. USA Inc. | Income Statement Drilldown 148 HOUSE_OVERSIGHT_020915
Page 93 - HOUSE_OVERSIGHT_020916
Debt Level: Entitlement Spending Increased 11x (1965 to 2010), While Real GDP Grew 3x USA Real Federal Expenses, Entitlement Spending, Real GDP % Change, 1965 — 2010 ABET G mm me 2 mee ce = ce es = em a = a 9 SS 9 SS Re Fu = % Entitlement Expenses Total Expenses ty mes i ee ee ee Ee ee ooo ee ee oe SG ee aes ee mega 1O00% Entitlement Programs +10.6x — =Real GDP 2 800% @ 5 Total — E Ps 600% xpenses = @ +3.3x = Oo se 400% Real GDP 200% +2.7x 0% T “+ ae T T T T TT T T T T T T T T T T T T T T T T T T T T T TT T T T T T T TT T T 1 1965 1969 1973 1977 1981 1985 1989 1993 1997 2001 2005 2009 Note: Data adjusted for inflation. Source: White House Office of Management and Budget. i USA Inc. | Income Statement Drilldown 149 Debt Level: Why It Has Risen Answer Part 2: Revenue (Esp. Corporate Taxes) Fell Below GDP Growth USA Real Federal Revenue vs. Real GDP % Change, 1965 — 2010 B00% Individual Income Taxes 500% -- CorporateIncome Taxes «8 i Social Insurance Taxes 400% ———— Other Taxes & Fees fe SSC meen: REARS) NV = dat me he Bt nt is tc ns pgs teem as ti ne ts tN 3 Total Revenue o = — -Real GDP E 300% -- — re a Do POUR me mee ee eo ce ee a ce oe = oO 4 NETS me mm a eo gg i «a aR nm = mw me mo tw ee ae 9 tw mt ell De 0% 1 AO0% 1965 1969 1973 1977 1981 1985 1989 1993 1997 2001 2005 2009 p Note: All data adjusted for inflation. Source: White House Office of Management and Budget, Bureau of Economic Analysis. a USA Inc. | Income Statement Drilldown 150 HOUSE_OVERSIGHT_020916
Sponsored
Page 94 - HOUSE_OVERSIGHT_020917
Debt Level: Recessions + Corporate Tax Accounting Changes Led to Revenue Underperformance (Relative to GDP Growth) USA Federal Receipts by Type ($B in 2005 Constant Dollars), 1965 — 2010 —— Individual Income Taxes =» Lower Corporate Taxes* 0 c T T T T T T T T — 1965 1970 1975 1980 1985 1990 1995 2000 2005 2010 oO wh 3 1,000 -- ——Corporate Income Taxes N Recessions £ ” Cl Oe ooo \ 4 ----- 7 F () rr 2001 / 2003 ov 1981 —> 5 Tax Cuts Tax Cuts E£ 600 -------------------------f%- Ne pot ------------------------ JBM ------ eee L 5 1981 2 Accelerated Cost Fs 400 J RecoverySystem = &B @ = 3 2 3 £ Note: * The adoption of Accelerated Cost Recovery System allowed companies to utilize accelerated depreciation on capital investments, leading to higher depreciation costs and lower taxable income. Source: White House Office of Management and Budget. Note that recession-related tax cuts can be KP doubled edged — reducing tax revenue but enhancing GDP growth. (@E www.kpcb.com USA Inc. | Income Statement Drilldown 151 Debt Level: In the Past, Social Security’s Surpluses Have Masked USA Inc.’s True Borrowing Needs by $1.4T e Social Security tax receipts exceeded outlays in every year between 1984 and 2008, leading to a cumulative surplus of $1.4 trillion. e These surpluses have been used to fund other parts of federal government operations (including Medicaid, infrastructure and defense...) under the unified budget accounting rules. Without these past Social Security surpluses, USA Inc. would have to have issued $1.4 trillion more debt (or 16% higher than current level of debt) to fund its operations. Social Security Cumulative Real Operating Surpluses / Deficits, 1982-2010 & $120 a E 38 $80 £ e Fe $40 Co) 6 $0 2 — =] & -$40 ” Ss 8 -$80 1982 1985 1988 1991 1994 1997 2000 2003 2006 2009 Note: Surpluses & deficits exclude Trust Fund interest income, adjusted for inflation. KP Data source: Congressional Budget Office. (@ www.kpcb.com USA Inc. | Income Statement Drilldown 152 HOUSE_OVERSIGHT_020917
Page 95 - HOUSE_OVERSIGHT_020918
Why Will Debt Level Continue to Rise? Public Debt Projected to Rise 2x Over Next 3 Decades Source: Congressional Budget Office Long-Term Budget Outlook (6/10), Alternative Fiscal Scenario (assuming a continuation of today’s underlying fiscal policy. This scenario deviates from CBO’s baseline because it incorporates some policy changes KP that are widely expected to occur and that policymakers have regularly made in the past). www.kpcb.com USA Inc. | Income Statement Drilldown 153 Net Federal Debt As % of GDP Debt Level: Projected to Rise 3x Over Next 2 Decades, per USA Inc.’s Own Estimates USA Public Federal Debt as % of GDP, 1982 — 2030 2030E Federal Debt = 146% of GDP 2010 Federal Debt = 62% of GDP 0% 1982 1986 1990 1994 1998 2002 2006 2010E 2014E 2018E 2022E 2026E 2030E Source: Congressional Budget Office Long-Term Budget Outlook (6/10), Alternative Fiscal Scenario (assuming a continuation of today’s underlying fiscal policy. This scenario deviates from CBO’s baseline because it incorporates some policy changes that are widely expected to occur and that policymakers P have regularly made in the past). (@E) www.kpcb.com USA Inc. | Income Statement Drilldown 154 HOUSE_OVERSIGHT_020918
Page 96 - HOUSE_OVERSIGHT_020919
Debt Level: Why Will It Continue to Rise? Answer Part 1: Notional Social Security “Trust Fund” Surpluses Likely Turning Into Deficits Owing to Aging Population Social Security Cumulative Real Operating Surpluses / Deficits, 1982-2037E Cumulative Surpluses Projected Cumulative (1982-2008) Reduced MES Deficits (2009-2037E) Federal Debt by Could Increase Federal $1.4T Debt by $11.6T Social Security Operating Income ($B) 1982 1987 1992 1997 2002 2007 2012E 2017E 2022E 2027E 2032E 2037E Note: Surpluses & deficits exclude Trust Fund interest income, adjusted for inflation in 2009 dollars. KP Source: Congressional Budget Office. (@)E) www.kpcb.com USA Inc. | Income Statement Drilldown 155 Debt Level: Why Will It Continue to Rise? Answer Part 2: Notional Medicare* “Trust Fund” Surpluses Likely urning Into Deficits Owing to Aging Population Medicare Part A* Cumulative Real Operating Surpluses / Deficits, 1982-2037E $100 & $0 a E ° ) = 2 -$100 rs @ a fe) = -$200 a ¢ Cumulative Surpluses Projected Cumulative 2 (1982-2008) Reduced MEN Deficits (2009-2037E) ks -$300 Federal Debt by Could Increase Federal $21B Debt by $5T -$400 1983 1988 1993 1998 2003 2008 2013E 2018E 2023E 2028E 2033E Note: Data are adjusted for inflation in 2009 dollars. *Only Medicare Part A (hospital insurance) has a trust fund (funded by payroll taxes), Part B (medical KP insurance) and Part D (prescription drug benefits) are primarily funded by general tax revenue and premium / co-payments. Source: Medicare Trustees. (@E) www.kpcb.com USA Inc. | Income Statement Drilldown 156 HOUSE_OVERSIGHT_020919
Sponsored
Page 97 - HOUSE_OVERSIGHT_020920
Debt Level: Why Will It Continue to Rise? Answer Part 3: Potential Loss on Guarantees on Fannie Mae / Freddie Mac Originations Could Rise Government-Sponsored Enterprises Gross Debt Composition, 1971 — 2008 = Freddie Mac RMBS* = Fannie Mae RMBS* a Freddie Mac Corporate Debt = Fannie Mae Corporate Debt Total GSE Debt Outstanding ($B) a Other Debt 1971 1976 1981 1986 1991 1996 2001 2006 Note: *RMBS is residential mortgage-backed securities. Other debt includes those issued by other federal agencies such as KP Federal Home Loan Banks and Student Loan Marketing Association (Sallie Mae). Source: FHFA Report to the Congress 2009. (@)E) www.kpcb.com USA Inc. | Income Statement Drilldown 157 Debt Level: GSEs’ Expansion Into ‘Non-Conventional’ Mortgage Lending Business Has Proved to Be Costly So Far Fannie Mae Credit Losses by Type of Mortgage Product, 1008 — 2Q10 CO ee = Other Non-Conventional Non- $6,000 -_- SSubprime Conventional , BAItA Mortgages = = Interest Only 30% of Fannie = Conventional Mae’s Total 4 Loan Guarantee Balance, But Causing 70-80% Quarterly Credit Losses ($MM) of Losses Owing to Lower Loan Quality 1908 2008 3008 49008 1Q09 2009 3Q09 4009 1Q10 2Q10 KP Source: Fannie Mae, Betsy Graseck, Morgan Stanley Research. a USA Inc. | Income Statement Drilldown 158 HOUSE_OVERSIGHT_020920
Page 98 - HOUSE_OVERSIGHT_020921
Debt Level: Fannie Mae + Freddie Mac = Latest Estimated Ultimate Cost to Taxpayers Varies* Base-Case Estimated Ultimate Source Comments / Assumptions Net Loss** Net accrued loss to be borne by taxpayers, including net cash infusions (with implied default rate of ~5- 10%) and risk premiums associated with federal Congressional government’s implicit guarantee on GSEs’ credit. $389 Billion Budget Office Bulk of the net loss ($291B) occurred prior to and (CBO) during F2009. On a cash basis, CBO’s estimate would have been in line with White House OMB’s estimate. Net cash outlay to be borne by Treasury Dept. (and ; ultimately taxpayers), including Treasury Dept.’s cash ae a outlays to purchase Fannie Mae & Freddie Mac $160 Billion Management and preferred stock (with implied default rate of ~5-10%), Budget (OMB) minus cash received from dividends. Bulk of the net cash outlay ($112B) occurred prior to and during F2009. Note: *Latest estimated cost to taxpayers varies and continues to rise. **By F2019E. Source: CBO, OMB. (@)E) www.kpcb.com USA Inc. | Income Statement Drilldown 159 Debt Level: Scenario Math — What Various Default Rates Could Mean for Taxpayer Ultimate Cash Cost of Fannie Mae & Freddie Mac Fannie Mae / Freddie Mac : Ultimate Cash Cost Outstanding Loan Guarantees x Desreni Beeites x Loss Severity" ss to Taxpayer Outstanding Default Ultimate Cash Cost Loan Guarantees mm] Loss Severity* to Taxpayer $50 Billion $160 Billion 8125 Billion | Billion $5 Trillion’ Current CBO/ OMB Forecasts (before $260 Billion | Billion of Ultimate Cash government Cost of Fannie conservatorship = $375 Billion Mae en ac 9/08) $500 Billion $625 Bilin | Billion Note: * Loss severity is liquidation value (foreclosure auction or other means) as a % of the loan amount adjusted for any K P advances and fees. Source: 1) Fannie Mae, Freddie Mac. (@E) www.kpcb.com USA Inc. | Income Statement Drilldown 160 HOUSE_OVERSIGHT_020921
Page 99 - HOUSE_OVERSIGHT_020922
Rising Debt Periodic Large Level & Interest One-Time Payments Charges Entitlement Spending Effective Interest Rates Note: *denotes F2010 net income / net loss of respective programs, data per White House OMB. 1) Medicare and Social Security net loss excludes Trust Fund interest income. 2) TARP net loss includes proceeds from sale of warrants. TARP is Troubled Asset Relief Program; ARRA KP is American Recovery & Reinvestment Act programs. (@)E) www.kpcb.com USA Inc. | Income Statement Drilldown 161 Effective Interest Rates: While USA Debt Has Risen Steadily Since 1981, Rates Have Fallen Steadily, so the Cost of Debt Has Potentially Been Held Artificially Low USA Net Federal Debt Outstanding & Effective Interest Rates, 1980 — 2010 BT me mm wm — mn ae ee se i nc nH a 10% mama Net Debt Outstanding Effective Interest Rates $8,000 - = = = 30-Year Avg. Effective Interest Rate Net Debt Outstanding ($B) Effective Interest Rates (%) $0 FF T T T T T T T T T T T T T T T T T T T T T T T T T T T T T 1 0% 1980 1983 1986 1989 1992 1995 1998 2001 2004 2007 2010 KP Source: White House Office of Management and Budget. (@E) www.kpcb.com USA Inc. | Income Statement Drilldown 162 HOUSE_OVERSIGHT_020922
Sponsored
Page 100 - HOUSE_OVERSIGHT_020923
Effective Interest Rates: While USA Debt Has Risen, Net Interest Payments Have Fallen USA Net Federal Debt Outstanding & Net Interest Payments, 1980 — 2010 BELO ne men me co — er ee we eet — ne cee ct tet — ie ee ct Ht ede lt at ee ts Ut es od i i! — at $500 mas Net Debt Outstanding —Net Interest Payments $8,000 ---- $400 mo mo & & 2 2 S $6,000 $300 = < £ g a 3) 5 rt 9 o & $4,000 $200 § Qa £ o o za z $2,000 $100 $0 $0 1980 1983 1986 1989 1992 1995 1998 2001 2004 2007 2010 KP Source: White House Office of Management and Budget. (@)E) www.kpcb.com USA Inc. | Income Statement Drilldown 163 Effective Interest Rates: Hypothetical Exercise — If USA 2009 Cost of Debt Was Paid at 30-Year Average Interest Rate Level of 6% vs. Current 2%, Annual Interest Cost Would Rise 3x to $566 Billion from $196 Billion USA Actual & Hypothetical Net Interest Payments’, 1980 — 2010 BB me me re ew oe ws re ee nm rt a — SR RS RE re RS — ARE ro SSA ra nS — -Hypothetical Net Interest Payments, Assuming 4 30-Year Average Effective Interest Rate of 6.25% / S500 sa et — as a an — ER SS / - Actual Net Interest Payments / Would have BAO m-mmem- oF been $3708 1 higher Net Interest Payments ($B) $0 r T T T 1 1980 1983 1986 1989 1992 1995 1998 2001 2004 2007 2010 Note: * Hypothetical net interest payments calculation assumes all other variables (such as GDP, revenue, spending, debt KP levels, etc.) are held constant. Source: White House Office of Management and Budget. (@E) www.kpcb.com USA Inc. | Income Statement Drilldown 164 HOUSE_OVERSIGHT_020923
Entities Mentioned
\E
\e ef
PERSON
Name reference in documents

Al Gore
PERSON • 2 mentions
Vice President of the United States from 1993 to 2001 (born 1948)

Alan Dershowitz
PERSON
American lawyer, author, and art collector (born 1938)

Alan Greenspan
PERSON
American economist and financial advisor (born 1926)
AA
Alan J. Auerbach
PERSON
American economist
AF
Amy Finkelstein
PERSON
American economist

Barack Obama
PERSON • 2 mentions
President of the United States from 2009 to 2017
BY
BB Yo
PERSON
Name reference in documents
BN
Bee eee ee ncaa
PERSON
Name reference in documents

Ben Bernanke
PERSON
American economist (born 1953)
BG
Betsy Graseck
PERSON
Name reference in documents
BN
Bt nt
PERSON
Name reference in documents

Carmen Reinhart
PERSON
American economist

ce Sn et
PERSON
Name reference in documents

Chris Liddell
PERSON
New Zealand-born US-citizen businessman

David Blumenthal
PERSON
Academic physician and health care policy expert
Doug Simpson
PERSON
Name reference in documents

Ean Tray
PERSON
Name reference in documents
E=
ee eee es cee ses es =r
PERSON
Name reference in documents
ED
eee Sa na |Ingome Statement Drildown
PERSON
Name reference in documents

Eleanor Roosevelt
PERSON
First Lady of the United States from 1933 to 1945 (1884–1962)
Emil Henry
PERSON
American government official

Fred Miller
PERSON
American football player (1906-1954)

Ge Se SR
PERSON
Name reference in documents

George P. Shultz
PERSON
American politician (1920–2021)
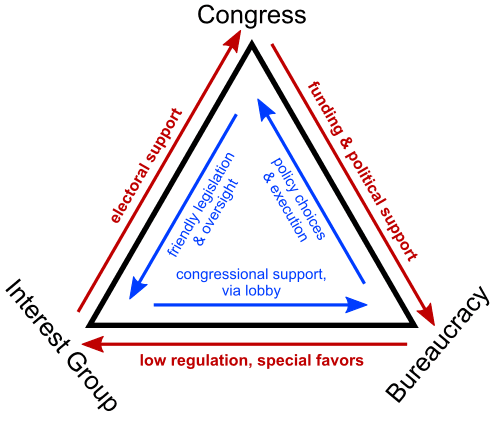
Gordon Adams
PERSON
Name reference in documents

Greg Jonas
PERSON
Name reference in documents
GT
GU TG
PERSON
Name reference in documents
HE
Heparimentier Emsray Establish
PERSON
Name reference in documents

James Morone
PERSON
American political scientist

Jeffrey Brown
PERSON
American journalist

Jeffrey Epstein
PERSON
American sex offender and financier (1953–2019)

John Cogan
PERSON
Professor of law

John Doerr
PERSON
American businessman

Julie K. Brown
PERSON
American journalist

Katherine Kuang
PERSON
Name reference in documents

Kenneth Rogoff
PERSON
Economist and chess player

Laurence J. Kotlikoff
PERSON
American economist

Liang Wu
PERSON
Researcher ORCID 0000-0002-5208-7318

Louis Johnston
PERSON
Name reference in documents

Marc Rich
PERSON
American commodities trader (1934–2013)

Mary Meeker
PERSON
American venture capitalist and securities analyst
ME
MeasuringWorth
PERSON
Name reference in documents

Meg Whitman
PERSON
American business executive

Michael Bloomberg
PERSON
American businessman and politician; 108th Mayor of New York City
N=
nae eo tw =
PERSON
Name reference in documents
NW
Net Worth
PERSON
Person referenced in documents
NG
ng Al gece
PERSON
Name reference in documents
OH
oli Htthitth
PERSON
Name reference in documents

Orin S. Kramer
PERSON
Name reference in documents

Paul Volcker
PERSON • 2 mentions
American economist (1927-2019)
PD
Peter Dimond
PERSON
Australian rugby league footballer

Peter Orszag
PERSON
American economist and Chairman & CEO of Lazard

Pre Dru
PERSON
Name reference in documents

Reinhart
PERSON
Refers to Bruce Reinhart, former federal prosecutor who became Palm Beach County judge in Epstein case

Richard Berner
PERSON
Name reference in documents

Richard Ravitch
PERSON
American politician (1933–2023)

Rob Valletta
PERSON
Name reference in documents

Rogoff
PERSON
Surname or name fragment in documents
RH
rrr rrr rrr re ii SE nt na at nom Hum
PERSON
Name reference in documents

Samantha Power
PERSON
Irish-American academic, author and diplomat
SW
Samuel H. Williamson
PERSON
Cofounder and president of MeasuringWorth and Professor Emeritus, Miami University
SG
se ce ee gS Ge
PERSON
Name reference in documents

Se Gn YS
PERSON
Name reference in documents

sere Kae
PERSON
Name reference in documents
TR
Tatialdeeenaheiataldes nat |\Rindaaieaeaieianesieeianaeedeniaabiadememnntr ra
PERSON
Name reference in documents

Thomas Jefferson
PERSON • 2 mentions
President of the United States from 1801 to 1809
TT
ti ne ts tN
PERSON
Name reference in documents
T=
tse nae t= = fe =
PERSON
Name reference in documents
WR
wei RG
PERSON
Name reference in documents
XX
Xxvii
PERSON
Name reference in documents
-$597 USA Inc.
ORGANIZATION
Organization referenced in documents
= USA Balance Sheet Liabilities Composition
ORGANIZATION
Organization referenced in documents
=u Personnel
ORGANIZATION
Organization referenced in documents
0 ne O:'N &
ORGANIZATION
Organization referenced in documents
Accelerated Cost Recovery System
ORGANIZATION
Organization referenced in documents
all USA Inc.’s
ORGANIZATION
Organization referenced in documents
American Recovery &
ORGANIZATION
Organization referenced in documents
American Recovery & Reinvestment Act
ORGANIZATION
Organization referenced in documents
Americans Receiving Govt
ORGANIZATION
Organization referenced in documents
an Average Retiree’s Income
ORGANIZATION
Organization referenced in documents
another, USA Inc.’s
ORGANIZATION
Organization referenced in documents
Army + Navy
ORGANIZATION
Organization referenced in documents
Around USA Inc.
ORGANIZATION
Organization referenced in documents
Baseline Real GDP Growth
ORGANIZATION
Organization referenced in documents
BB EB
ORGANIZATION
Organization referenced in documents
BELO ne
ORGANIZATION
Organization referenced in documents
Birth, 1935 & 2009 USA Full Retirement Age, 1935 & 2009
ORGANIZATION
Organization referenced in documents

Bloomberg L.P.
ORGANIZATION
American privately held financial, software, data, and media company
Blue Cross Blue Shield
ORGANIZATION
Health insurance company
Bond Owners Survey
ORGANIZATION
Organization referenced in documents
Breakdown
ORGANIZATION
Organization referenced in documents
Budget Analytical Perspective
ORGANIZATION
Organization referenced in documents
Budget Office
ORGANIZATION
Organization referenced in documents

Bureau of Labor Statistics
ORGANIZATION
US government agency
Business Lines
ORGANIZATION
Organization referenced in documents
Business Monitor International
ORGANIZATION
Organization referenced in documents
Ce USA Inc.
ORGANIZATION
Organization referenced in documents
Census Bureau State & Local Government Finance
ORGANIZATION
Organization referenced in documents
Center for Strategic and International Studies
ORGANIZATION
Organization referenced in documents
Centers for Disease Control
ORGANIZATION
Organization referenced in documents
Colonial Times
ORGANIZATION
Organization referenced in documents
commerce & housing
ORGANIZATION
Organization referenced in documents
Community Development / Sewerage & Waste Management
ORGANIZATION
Organization referenced in documents
Complex Social Insurance Program
ORGANIZATION
Organization referenced in documents

Congressional Research Service
ORGANIZATION
United States federal agency

Creative Commons
ORGANIZATION
Non-profit-organization creating copyright licenses for the public release of creative works
Debt Levels & Related Expenses
ORGANIZATION
Organization referenced in documents
Dept. of
ORGANIZATION
Organization referenced in documents
Dept. of Defense
ORGANIZATION
Organization referenced in documents

Development
ORGANIZATION
Scientific journal
Did USA Inc.'s
ORGANIZATION
Organization referenced in documents
Disability Insurance
ORGANIZATION
Organization referenced in documents
Drilldown on USA Inc. Financials
ORGANIZATION
Organization referenced in documents
Drive USA Inc.
ORGANIZATION
Organization referenced in documents
e Education
ORGANIZATION
Organization referenced in documents
e Unemployment Insurance and
ORGANIZATION
Organization referenced in documents
ec OMX
ORGANIZATION
Organization referenced in documents
Economic Recovery Advisory Board
ORGANIZATION
Organization referenced in documents
Education Spending
ORGANIZATION
Organization referenced in documents
ee ee ag ae 9 mae oe
ORGANIZATION
Organization referenced in documents
Environment & Housing (Parks & Recreation
ORGANIZATION
Organization referenced in documents
Era of Expansion
ORGANIZATION
Organization referenced in documents
Expanded Eligibility Group
ORGANIZATION
Organization referenced in documents
F Community
ORGANIZATION
Organization referenced in documents

Fannie Mae
ORGANIZATION
Government-backed financial services company
Fannie Mae & Freddie Mac
ORGANIZATION
Organization referenced in documents
Federal / state & local
ORGANIZATION
Organization referenced in documents
Federal / State & Local Governments Share Different Responsibilities
ORGANIZATION
Organization referenced in documents
Federal Budget Surplus / Deficit
ORGANIZATION
Organization referenced in documents
Federal Debt
ORGANIZATION
Organization referenced in documents
Federal Medicaid
ORGANIZATION
Organization referenced in documents
Federal Spending
ORGANIZATION
Organization referenced in documents
FHFA Report
ORGANIZATION
Organization referenced in documents
Financial Outlook
ORGANIZATION
Organization referenced in documents
Financial Reality
ORGANIZATION
Organization referenced in documents
Fiscal Analysis
ORGANIZATION
Organization referenced in documents
Focus on Federal
ORGANIZATION
Organization referenced in documents
Focus on Federal Government Dynamics
ORGANIZATION
Organization referenced in documents
Focus on Operating Efficiency - + ss
ORGANIZATION
Organization referenced in documents
food & nutrition
ORGANIZATION
Organization referenced in documents
Forest Service
ORGANIZATION
Agency of the U.S. Department of Agriculture

Freddie Mac
ORGANIZATION
American government-sponsored enterprise
Funding Source
ORGANIZATION
Organization referenced in documents

General Motors
ORGANIZATION
American multinational automotive company
Government Social Benefits
ORGANIZATION
Organization referenced in documents

Haver Analytics
ORGANIZATION
Ice hockey statistics
Heaith & Human Services
ORGANIZATION
Organization referenced in documents
Health Indicators USA Median
ORGANIZATION
Organization referenced in documents
Health Statistics
ORGANIZATION
Organization referenced in documents
Healthcare 724
ORGANIZATION
Organization referenced in documents
Healthcare Spending
ORGANIZATION
Organization referenced in documents
hospital & medical Fund
ORGANIZATION
Organization referenced in documents
House Budget Committee
ORGANIZATION
Organization referenced in documents
Household and Government Savings
ORGANIZATION
Organization referenced in documents
Housing + Healthcare Spending
ORGANIZATION
Organization referenced in documents
Housing 36 Administration
ORGANIZATION
Organization referenced in documents
Includes Disability Insurance
ORGANIZATION
Organization referenced in documents
Investment Company Institute
ORGANIZATION
Organization
K P Administration
ORGANIZATION
Organization referenced in documents
K P Source
ORGANIZATION
Organization referenced in documents
Ke Care Insurance Market
ORGANIZATION
Organization referenced in documents
KP “Dept. of Health & Human Services
ORGANIZATION
Organization referenced in documents
KP Automatic Stabilizers
ORGANIZATION
Organization referenced in documents
KP Data
ORGANIZATION
Organization referenced in documents
KP Data Source
ORGANIZATION
Organization referenced in documents
KP Federal Home Loan Banks and Student Loan Marketing Association
ORGANIZATION
Organization referenced in documents
KP Government
ORGANIZATION
Organization referenced in documents
KP of Management and Budget
ORGANIZATION
Organization referenced in documents
KP September
ORGANIZATION
Organization referenced in documents
KP USA federal fiscal year
ORGANIZATION
Organization referenced in documents
Lacks Sufficient Dedicated Funding
ORGANIZATION
Organization referenced in documents
Leaner and
ORGANIZATION
Organization referenced in documents
Level & Interest
ORGANIZATION
Organization referenced in documents
Long-Term Budget Outlook
ORGANIZATION
Organization referenced in documents
Lyndon B. Johnson Library & Museum
ORGANIZATION
Organization referenced in documents
Major ‘Business Line’ Spending
ORGANIZATION
Organization referenced in documents
Manpower Research
ORGANIZATION
Organization referenced in documents
Meaner National Defense
ORGANIZATION
Organization referenced in documents

Medicaid
ORGANIZATION
United States social health care program for families and individuals with limited resources
Medicaid & Nutrition Assistance
ORGANIZATION
Organization referenced in documents
Medical Insurance
ORGANIZATION
Organization referenced in documents
Medicare / Medicaid & One-Time Charges
ORGANIZATION
Organization referenced in documents
Medicare & Medicaid
ORGANIZATION
Organization referenced in documents
Medicare & Medicaid Payments
ORGANIZATION
Organization referenced in documents
Medicare Revenue & Expenses
ORGANIZATION
Organization referenced in documents
Medicare Trust
ORGANIZATION
Organization referenced in documents
Medicare Trust Funds’
ORGANIZATION
Organization referenced in documents
More Like Accounting Values
ORGANIZATION
Organization referenced in documents
Morgan Stanley Healthcare Research
ORGANIZATION
Organization referenced in documents
Morgan Stanley Research
ORGANIZATION
Organization referenced in documents
National Center for Health Statistics
ORGANIZATION
Organization referenced in documents
National Conference of State Legislatures
ORGANIZATION
Organization referenced in documents
National Parks
ORGANIZATION
Organization referenced in documents
National’ Education Spending
ORGANIZATION
Organization referenced in documents
National’ Healthcare Spending
ORGANIZATION
Organization referenced in documents
ND Ee
ORGANIZATION
Organization referenced in documents
Net Income & Median Net Margin
ORGANIZATION
Organization referenced in documents
Newly Extended Unemployment Benefits
ORGANIZATION
Organization referenced in documents
Nf Nf EQ fe Nef
ORGANIZATION
Organization referenced in documents
Non-Defense Discretionary
ORGANIZATION
Organization referenced in documents
Notional Social Security “Trust Fund
ORGANIZATION
Organization referenced in documents
OECD USA Ranking
ORGANIZATION
Organization referenced in documents
Old Age Group
ORGANIZATION
Organization referenced in documents
ome = ss
ORGANIZATION
Organization referenced in documents
oO & Ww
ORGANIZATION
Organization referenced in documents
Operations of USA Inc. Are Solid
ORGANIZATION
Organization referenced in documents
Organization for Economic Co-operation and
ORGANIZATION
Organization referenced in documents
Overview of USA Inc.’s
ORGANIZATION
Organization referenced in documents
Own Estimates
ORGANIZATION
Organization referenced in documents

Peter G. Peterson
ORGANIZATION
Organization referenced in documents

Pew Research
ORGANIZATION
Suburb of Melbourne, Victoria, Australia

Pew Research Center
ORGANIZATION
Think tank based in Washington, D.C., US
Physical Resources (Energy / Housing...
ORGANIZATION
Organization referenced in documents
Politicians Work
ORGANIZATION
Organization referenced in documents
Potential Policy Solutions
ORGANIZATION
Organization referenced in documents
PPP Adj
ORGANIZATION
Organization referenced in documents
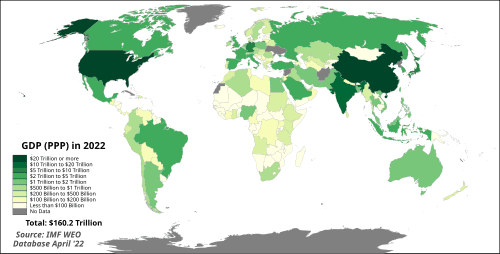
Purchasing Power Parity
ORGANIZATION
Organization referenced in documents
Rank Challenge
ORGANIZATION
Organization referenced in documents
readjusting USA Inc.’s
ORGANIZATION
Organization referenced in documents
Research, Development, Test & Evaluation
ORGANIZATION
Organization referenced in documents
Resources Allocated to Housing + Healthcare
ORGANIZATION
Organization referenced in documents
Rising Debt Level and Interest Payments
ORGANIZATION
Organization referenced in documents
Rising Healthcare Costs
ORGANIZATION
Organization referenced in documents
Rising Rapidly
ORGANIZATION
Organization referenced in documents
S S SS
ORGANIZATION
Organization referenced in documents
Sallie Mae
ORGANIZATION
Organization referenced in documents
sas ao S55 & Dg
ORGANIZATION
Organization referenced in documents
Securities Industry and Financial Markets Association
ORGANIZATION
Organization referenced in documents
Security Trust
ORGANIZATION
Organization referenced in documents
Senate Joint Economic Committee Report
ORGANIZATION
Organization referenced in documents
Ses Ss fk
ORGANIZATION
Organization referenced in documents
SF GB
ORGANIZATION
Organization referenced in documents
Social "Wadicare
ORGANIZATION
Organization referenced in documents
Social ah 5 * Increase Social Security
ORGANIZATION
Organization referenced in documents

Social Insurance
ORGANIZATION
Government-sponsored social program
Social Insurance Program Created
ORGANIZATION
Organization referenced in documents
Social Insurance Taxes
ORGANIZATION
Organization referenced in documents
Social Security / Medicare / Medicaid
ORGANIZATION
Organization referenced in documents
Social Security & Medicare Part
ORGANIZATION
Organization referenced in documents
Social Security + Healthcare
ORGANIZATION
Organization referenced in documents
Social Security Administration Office of Retirement
ORGANIZATION
Organization referenced in documents
Social Security Amendments
ORGANIZATION
Organization referenced in documents
Social Security and Unemployment Insurance
ORGANIZATION
Organization referenced in documents
Social Security Beneficiary
ORGANIZATION
Organization referenced in documents
Social Security Cumulative Real Operating Surpluses
ORGANIZATION
Organization referenced in documents
Social Security Funding
ORGANIZATION
Organization referenced in documents
Social Security Social Security
ORGANIZATION
Organization referenced in documents
Social Security Trust Fund Social Security Trust Fund
ORGANIZATION
Organization referenced in documents
Social Security Was Created
ORGANIZATION
Organization referenced in documents
Social Security: America
ORGANIZATION
Organization referenced in documents
Social Security's
ORGANIZATION
Organization referenced in documents
Social Welfare Program
ORGANIZATION
Organization referenced in documents
Sos en os Ss
ORGANIZATION
Organization referenced in documents
SR RS
ORGANIZATION
Organization referenced in documents
State &
ORGANIZATION
Organization referenced in documents
State & Local Government
ORGANIZATION
Organization referenced in documents
Stockholm International Peace Research Institute
ORGANIZATION
Organization referenced in documents
Tax Foundation
ORGANIZATION
Organization referenced in documents
Te ener enw
ORGANIZATION
Organization referenced in documents
Technology / Infrastructure / Education
ORGANIZATION
Organization referenced in documents
TEE Il
ORGANIZATION
Organization referenced in documents
Temiparary Assistance
ORGANIZATION
Organization referenced in documents
TFT &
ORGANIZATION
Organization referenced in documents
the Census Bureau
ORGANIZATION
U.S. Census Bureau - federal statistics agency
The Challenge Before Us
ORGANIZATION
Organization referenced in documents
the Congress 2009
ORGANIZATION
Organization referenced in documents
the Congressional Budget Office
ORGANIZATION
Organization referenced in documents
the Defense Business Board
ORGANIZATION
Organization referenced in documents
the Dept. of Commerce
ORGANIZATION
Organization referenced in documents
The Esquire Commission to Balance the Federal Budget
ORGANIZATION
Organization referenced in documents
the Federal Budget
ORGANIZATION
Organization referenced in documents
the Federal Unemployment Insurance Trust Fund
ORGANIZATION
Organization referenced in documents
the Financial Reality (& Negative Trend
ORGANIZATION
Organization referenced in documents
the Greenspan Commission
ORGANIZATION
Organization referenced in documents
The Journal of Economic Perspectives
ORGANIZATION
Organization referenced in documents
the Kaiser Family Foundation
ORGANIZATION
Organization referenced in documents
the Long-Term
ORGANIZATION
Organization referenced in documents
the National Bureau of Economic Research
ORGANIZATION
Organization referenced in documents
The Original Estimates of
ORGANIZATION
Organization referenced in documents
The Patient Protection and Affordable Care Act
ORGANIZATION
Organization referenced in documents
the Public Debt $1 $1 $5 $7 $
ORGANIZATION
Organization referenced in documents
the Public Debt $2 $3 $4 $40 $659 $
ORGANIZATION
Organization referenced in documents
the Social Security Trust Fund
ORGANIZATION
Organization referenced in documents
the State Level by Design — State
ORGANIZATION
Organization referenced in documents
the Troubled Asset Relief Program
ORGANIZATION
Organization referenced in documents
the U.S. Government’
ORGANIZATION
Organization referenced in documents

the United States Government
ORGANIZATION
United States federal government
The Washington Times
ORGANIZATION
The Washington Times, American daily newspaper
TN ER
ORGANIZATION
Organization referenced in documents
Total Healthcare Total Healthcare
ORGANIZATION
Organization referenced in documents
Total USA, Inc.
ORGANIZATION
Organization referenced in documents
Transportation (Road Construction & Maintenance
ORGANIZATION
Organization referenced in documents
Treasury Dept
ORGANIZATION
Organization referenced in documents

Trends
ORGANIZATION
Series of review journals in biology and chemistry
Turn Around USA Inc.’s
ORGANIZATION
Organization referenced in documents
Type of Mortgage Product
ORGANIZATION
Organization referenced in documents
U.S. Department of Health & Human Services
ORGANIZATION
Organization referenced in documents

U.S. Treasury
ORGANIZATION
United States Department of the Treasury, executive department of the federal government
UI Benefits
ORGANIZATION
Organization referenced in documents
Unemployment Insurance and Social Security
ORGANIZATION
Organization referenced in documents

UnitedHealth
ORGANIZATION
Organization referenced in documents
US Dept. of
ORGANIZATION
Organization referenced in documents
USA 2009 Cost of Debt
ORGANIZATION
Organization referenced in documents
USA Actual & Hypothetical Net Interest Payments’
ORGANIZATION
Organization referenced in documents
USA Full Retirement Age
ORGANIZATION
Organization referenced in documents
USA Inc. Inflation-Adjusted* Defense Spending
ORGANIZATION
Organization referenced in documents
USA Inc. Profit & Loss
ORGANIZATION
Organization referenced in documents
USA Inc.’s
ORGANIZATION
Organization referenced in documents
USA ING
ORGANIZATION
Organization referenced in documents
USA Labor Force
ORGANIZATION
Organization referenced in documents
USA Life Expectancy
ORGANIZATION
Organization referenced in documents
USA Real Federal
ORGANIZATION
Organization referenced in documents
USA Spending on
ORGANIZATION
Organization referenced in documents
Veterans’ Administration
ORGANIZATION
Organization referenced in documents
Ways & Means
ORGANIZATION
Organization referenced in documents
Welfare 28 Children
ORGANIZATION
Organization referenced in documents
White House Office
ORGANIZATION
Organization referenced in documents
White House Office of Management and Budget, Bureau of Economic Analysis
ORGANIZATION
Organization referenced in documents
White House Office of Management and Budget, Congressional Budget Office
ORGANIZATION
Organization referenced in documents
Y/Y Growth -
ORGANIZATION
Organization referenced in documents

Alaska
LOCATION
State of the United States of America

Belgium
LOCATION
Country in western Europe

Denmark
LOCATION
Country in Northern Europe and North America
Desreni Beeites
LOCATION
Location referenced in documents

Finland
LOCATION
Country in Northern Europe
Hm St
LOCATION
Location referenced in documents
Ho es
LOCATION
Location referenced in documents

Hungary
LOCATION
Country in Central Europe

Ireland
LOCATION

Luxembourg
LOCATION
Country in Western Europe

New Zealand
LOCATION
Island country in the southwest Pacific Ocean

North Korea
LOCATION
Sovereign state in East Asia

Norway
LOCATION
Country in Northern Europe

Puerto Rico
LOCATION
Unincorporated territory of the United States of America
Slovak Republic
LOCATION
Location referenced in documents
Spending
LOCATION
Location referenced in documents
SUTTER
LOCATION
Location referenced in documents

United States
LOCATION
Country located primarily in North America
Statistics
Pages:100
Entities:339
Avg. OCR:87.2%
Sponsored