Back to Network

4
Shared Docs
4
Same-Page
4 / 4
Mentions
Document Mentions (4 shared documents)
2 mentions1 same-page
Page ?Same page
hort -0.061% G20 Rates Long 0.194% G20 Rates Short 0.002% T12M Contribution (% of total Yr/Yr NAV Change by Category) Listed Equities 47.89% EquityCom 45.17% G20 Rates 6.98% % of Total Notional Security MTM Gain % Total NAV 20.45%1 45 Positions 25.98% 0.11% P5120 Index 5,568 0.29% 0.1
7 -2.16 0.96% 63.95 BHP US Equity (51) 7,278 67.99 67.52 -0.77 0.91% 21.82 BBB US Equity 318 1,066 245.93 319.30 24.19 1.23% 2.22 BIL S1 Equity 159 (4,833) 32.51 31.44 4.90 0.67% 24.89 BK US Equity 517 8,609 32.86 34.84 7.92 0.76% 43.85 BLK US Equity 125 3,931 299.70 309.2
2 mentions1 same-page
Page ?Same page
-0.150% G20 Rates Long 0.289% G20 Rates Short -0.059% T12m Contribution (% of total Yr/Yr NAV Change by Category) Listed Equities 28.95% [ EquityCom 58.76% G20 Rates 12.29% % of Total Notional Security MTM Gain % Total NAV 30.53% 40 Positions 18.08% 1.05% XLB US Equity 4,417 0.21% 1
4.18 0.68% (174.73) BHP US Equity 286 9,032 68.57 70.74 4.02 0.79% (6.74) BBB US Equity 365 1,066 241.05 323.68 27.22 1.26% 2.74 BIL S1 Equity 33.56 BK US Equity 1,728 11,358 33.36 38.44 20.28 0.75% (81.24) BLK US Equity (84) 7,520 309.47 306.06 -1.68 0.66% 60.51 BLT IN Equ
2 mentions1 same-page
Page ?Same page
d Equities) & Maao (Equity Indices & Commodites, G20 Gov. Credit) 6 ,000,000 5,000,000 0,000,000 34"° 2,000,000 1,000,000 —AMA —(MCA —AMER — EquityCom —G20 Rates NexEposute REG 2.000.000 1,500,000 1.000.000 ► ff 500.000 Ott \ \ G \ \ \ \ \ "t? \ tat \ v1 tat \ i1/4..1:0 0 (2,000,0
.25 0.83% (125.60) BHP US Equity 81 7,278 68.00 68.75 1.14 0.97% (122.86) BOB US Equity 194 1,066 245.93 290.64 11.93 1.52% (1.22) BIL S1 Equity 26 (2,007) 32.75 32.32 1.79 0.72% 17.34 BK US Equity 299 8,609 32.86 34.00 4.03 0.86% (16.55) BLK US Equity 4 1,641 296.18 296.87
Sponsored
2 mentions1 same-page
Page ?Same page
LC 4/4/2014 Historical Net Exposure by Geography (Listed Equities) & Macro (Equity Indices & Commodlites, G20 Gov. Credit) —APAC —EMEA —AMER — EquityCom —G20 Rates NexEposure RHS 1.000,000 1,500,000 3,001,000 5,000.000 4,030.000 3,000.000 2,000.000 ,000.000 0 (3000.003) - (2,000,000) I F
2 1.38 1.24% 54.33 BHP US Equity 262 6,839 67.77 70.37 3.91 0.98% 92.44 BOB US Equity 198 1,066 245.93 291.70 11.53 1.61% (40.21) BIL S1 Equity (150) (2,114) 30.29 32.44 .6.23 1.14% (33.24) BK US Equity 546 8,609 32.86 34.95 8.16 0.78% (87.83) BLK US Equity 169 1,171 274.17
Sponsored
Mutual Connections (25)
Entities connected to both EquityCom and BIL S1 Equity
Ghislaine Maxwell
PERSON57 w/ EquityCom·11 w/ BIL
AT
Atorus
PERSON54 w/ EquityCom·9 w/ BIL
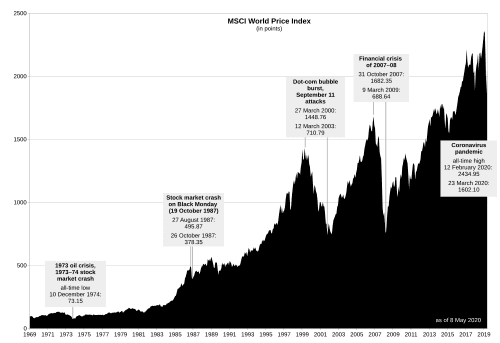
MSCI World
ORGANIZATION48 w/ EquityCom·8 w/ BIL
Current Portfolio -Listed Equity Portfolio
ORGANIZATION41 w/ EquityCom·6 w/ BIL
AU TSY
ORGANIZATION40 w/ EquityCom·6 w/ BIL
MSCI World Change
ORGANIZATION31 w/ EquityCom·5 w/ BIL
ENI IM Equity
ORGANIZATION31 w/ EquityCom·5 w/ BIL
Emmanuel Macron
PERSON29 w/ EquityCom·4 w/ BIL
Sharpe
ORGANIZATION20 w/ EquityCom·2 w/ BIL
SMSN LI Equity
ORGANIZATION16 w/ EquityCom·5 w/ BIL
Largest Exposures Current
ORGANIZATION15 w/ EquityCom·3 w/ BIL
BMW GR
ORGANIZATION16 w/ EquityCom·2 w/ BIL
AMZN US Equity
ORGANIZATION11 w/ EquityCom·3 w/ BIL
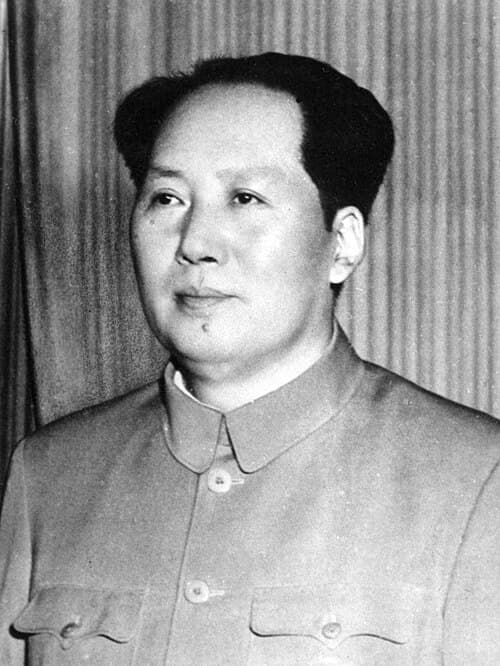
Mao Zedong
PERSON10 w/ EquityCom·3 w/ BIL
GE US Equity
ORGANIZATION10 w/ EquityCom·2 w/ BIL
CO
Comdty
PERSON8 w/ EquityCom·2 w/ BIL
BCS US Equity
ORGANIZATION6 w/ EquityCom·3 w/ BIL
Position (ex-99pct & ex-lst
ORGANIZATION7 w/ EquityCom·2 w/ BIL
SAP GR
ORGANIZATION4 w/ EquityCom·2 w/ BIL
Usted Equities) & Macro
ORGANIZATION4 w/ EquityCom·2 w/ BIL