Back to Network
5
Shared Docs
5
Same-Page
5 / 5
Mentions
Document Mentions (5 shared documents)
2 mentions1 same-page
Page ?Same page
.00 660,000.00 ..41ve\s'kval..4eA‘., ,z5G ANG GGGGGG (1, V de 19 19 (f? toC s CP CP e (s% ()is —NAV EFTA_R1_02139125 EFTA02714154 Atorus, LLC 4/3/2014 Largest Exposures Current Positions 97.5th Percentile 2.5th Percentile (@ cost ex- MTM) Security Notional 24 Positions XAU Comdty
3 0.62% (112.18) CNQ CN Equity 774 8,797 36.10 39.28 12.05 0.73% 90.68 CNR CN Equity 1,147 12,425 51.30 56.03 14.82 0.62% (128.58) COF US Equity 868 6,424 68.14 77.35 16.27 0.83% 21.75 COP US Equity (4S4) (7,980) 66.64 70.44 -11.40 0.50% 24.56 COST US Equity 111.79 0.58% - C
2 mentions1 same-page
Page ?Same page
Short • EMEA Long a EMEA Short a AMER Long a AMER Short • EquityCom Long • EquityCom Short • G20 Rates Long • G20 Rates Short EFTA00293071 Atorus, LLC 3/7/2014 Historical Net Exposure by Geography (Listed Equities) & Macro (Equity Indices & Comrnodlites, G20 Gov. Credit) 2,000,000 4500,000
38 0.64% (105.10) CNQ CN Equity 354 6,854 35.60 37.44 5.25 0.99% 43.62 CNR CN Equity 1,172 12,425 51.30 56.13 14.37 0.66% (106.73) COF US Equity 681 6,077 67.68 75.27 11.93 0.94% 28.07 COP US Equity 9 (7,980) 66.64 66.57 0.16 0.65% (13.41) COST US Equity (143) 7,901 115.69
2 mentions1 same-page
Page ?Same page
,403,2 ■ APAC ■ EMEA ■ AMER ■ EquityCom ■ G20 Rates Performance Vs. MSCI World Index Rolling 30 Day Realized Volatility -Atoms EFTA00293159 Atorus, LLC 3/13/2014 Percentile Distribution of Current MTM Gains In Vol Days by Position (ex-99pct & ex-1st percentiles) Øm 50.00 40.00 30.m 20.00
18.61 0.57% 29.18 CNQ CN Equity 0 7,768 35.76 35.76 0.00 1.01% (38.65) CNR CN Equity 1,349 12,425 51.30 56.86 18.34 0.59% (5.33) COF US Equity 491 6,077 67.68 73.15 8.80 0.92% (77.19) COP US Equity 39 (7,980) 66.64 66.31 0.85 0.58% 9.36 COST US Equity (58) 7,901 115.72 11
Sponsored
2 mentions1 same-page
Page ?Same page
194.51 MTM Gains(Losses) % of NAV "Signficant" (<7 Vol Days) 1.50% MTM Gains(Losses) % of NAV "Signficant" (>7 Vol Days) 50.89% EFTA00293138 Atorus, LLC Portfolio •Listed Equity Portfolio 3/13/2014 Current Price P/L in Vol 30P Realized Change on Day Security MTM Gain/(Loss) Exp. @ Cost A
18.61 0.57% 29.18 CNQ CN Equity 0 7,768 35.76 35.76 0.00 1.01% (38.65) CNR CN Equity 1,349 12,425 51.30 56.86 18.34 0.59% (5.33) COF US Equity 491 6,077 67.68 73.15 8.80 0.92% (77.19) COP US Equity 39 (7,980) 66.64 66.31 0.85 0.58% 9.36 COST US Equity (58) 7,901 115.72 11
2 mentions1 same-page
Page ?Same page
000 11, •'V 'V 11, O•y 'V 3 3 3 3 3 3 4 b c 9S o 0.% etr 10. 19> etr1,0% eti\ti e 4 A\ .5\ „ 4 4,va At, 4 —Series]. EFTA00288463 Atorus, LLC 6/6/2014 Largest Exposures Current Positions 97.5th Percentile 2.5th Percentile (@ cost ex- MTM) Largest MTM Gains Current Posi ions (90th P
9 0.42% 165.48 CNQ CN Equity 1,545 10,769 36.73 42.00 16.62 0.86% 127.51 CNR CN Equity 2,444 13,829 52.07 61.28 43.51 0.41% 174.34 COF US Equity 1,243 8,423 70.22 80.58 22.36 0.66% 120.64 COP US Equity 507 9,807 76.84 80.81 9.42 0.55% 114.98 COST US Equity 336 9,550 114.02
Sponsored
Mutual Connections (16)
Entities connected to both Atorus and COF US Equity
Ghislaine Maxwell
PERSON105 w/ Atorus·6 w/ COF
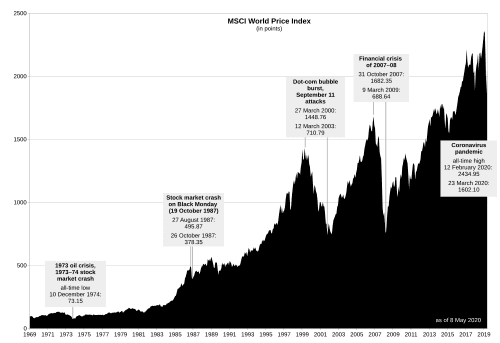
MSCI World
ORGANIZATION81 w/ Atorus·4 w/ COF
ENI IM Equity
ORGANIZATION67 w/ Atorus·3 w/ COF
AU TSY
ORGANIZATION65 w/ Atorus·3 w/ COF
Current Portfolio -Listed Equity Portfolio
ORGANIZATION62 w/ Atorus·2 w/ COF
MSCI World Change
ORGANIZATION56 w/ Atorus·3 w/ COF
EquityCom
ORGANIZATION54 w/ Atorus·3 w/ COF
SMSN LI Equity
ORGANIZATION45 w/ Atorus·2 w/ COF
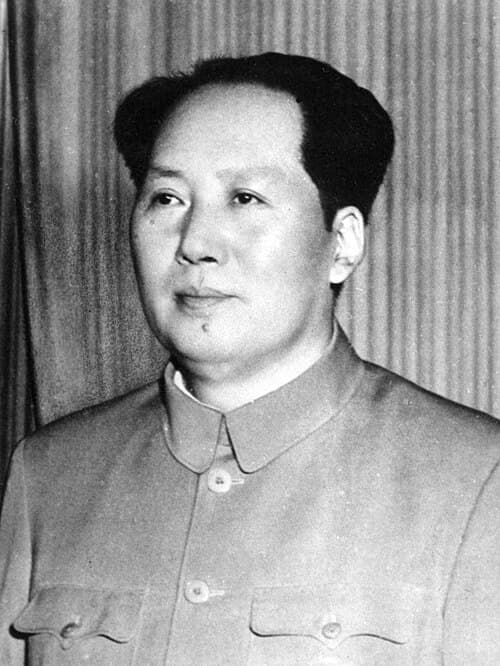
Mao Zedong
PERSON22 w/ Atorus·2 w/ COF
MCD US Equity
ORGANIZATION20 w/ Atorus·2 w/ COF
NSC US Equity
ORGANIZATION15 w/ Atorus·2 w/ COF
Equity Indices & Commodlites
ORGANIZATION14 w/ Atorus·2 w/ COF
BIL S.I Equity
ORGANIZATION9 w/ Atorus·2 w/ COF
STEICNZL
ORGANIZATION9 w/ Atorus·2 w/ COF
SAP GR
ORGANIZATION6 w/ Atorus·2 w/ COF
EquityCom Short
ORGANIZATION5 w/ Atorus·2 w/ COF