Back to Network
9
Shared Docs
9
Same-Page
9 / 9
Mentions
Document Mentions (9 shared documents)
2 mentions1 same-page
Page ?Same page
1)) sb 12, 41. 4s.. . . -65 • lsiv fir dv ds <;" st• st. 4 4 4s \ 0 0 % 19 19 "b 4 A\ 4' s 4 —NAV EFTA_R1_02124509 EFTA02711118 Atorus, LLC 3/20/2014 Largest Exposures Current Positions 97.5th Percentile 2.5th Percentile (@ cost ex- MTM) Security Notional 26 Positions IBOV Inde
1.20% (130.36) BHP US Equity (373) 6,839 67.57 64.08 -5.28 1.03% (50.94) Bile US Equity 440 1,066 245.93 347.42 31.39 1.31% (25.54) BIL S.I Equity 76 (2,643) 30.29 29.42 2.42 1.19% 43.82 8K US Equity 583 6,515 32.16 35.04 10.43 0.86% 241.62 BLK US Equity 113 1,171 274.17 300.
2 mentions1 same-page
Page ?Same page
GGGGGGGG G o o o C) O O O O O ) O (/' 0 0 4Y 0 e0 0 0' 4Y 0 4' 4 4 A\ s4 4 4 4 A\ 4 sr>\ 4 vb -NAV EFTA_R1_02139109 EFTA02714138 Atorus, LLC 4/4/2014 Largest Exposures Current Positions 97.5th Percentile 2.5th Percentile (@ cost ex- MTM) Security Notional 24 Positions XAU Comdty
1.38 1.24% 54.33 BHP US Equity 262 6,839 67.77 70.37 3.91 0.98% 92.44 Bile US Equity 198 1,066 245.93 291.70 11.53 1.61% (40.21) BIL S.I Equity (150) (2,114) 30.29 32.44 -6.23 1.14% (33.24) 8K US Equity 546 8,609 32.86 34.95 8.16 0.78% (87.83) BLK US Equity 169 1,171 274.17
2 mentions1 same-page
Page ?Same page
000.000.00 600,000.00 600,000.00 -ter km-Ave a \ a pw. e eee e eee e e ee t* 4 41' 4 S\et. e e e 4,sv e 11 AO' C5‘ e — NAV EFTA00292941 Atorus, LLC 2/14/2014 Largest Exposures 99th Percentile 1st Percentile (@ cost ex-MTM) Largest MTM Gains (95th Percentile MTM Gains % NAV) Security N
11 1,570 33.81 34.04 0.74 0.93% BHP US Equity 19 2,162 67.81 68.40 0.93 0.94% BIIB US Equity 361 1,066 245.93 329.19 23.14 1.46% BIL S.I Equity (196) (3,561) 30.26 31.92 -4.71 1.16% BK US Equity 60 1,539 30.62 31.81 4.50 0.86% BLK US Equity 127 1,171 274.17 303.93 11.69 0.
Sponsored
2 mentions1 same-page
Page ?Same page
Short • EMEA Long a EMEA Short a AMER Long a AMER Short • EquityCom Long • EquityCom Short • G20 Rates Long • G20 Rates Short EFTA00293071 Atorus, LLC 3/7/2014 Historical Net Exposure by Geography (Listed Equities) & Macro (Equity Indices & Comrnodlites, G20 Gov. Credit) 2,000,000 4500,000
0.95% (9.83) BHP US Equity (155) 5,280 68.70 66.74 -3.16 0.93% (112.60) BIIB US Equity 356 1,066 245.93 328.08 21.73 1.54% (60.81) BIL S.I Equity (528) 31.17 31.17 0.00 1.24% 10.36 BK US Equity 230 3,723 31.43 33.37 6.70 0.92% 70.18 BLK US Equity 157 1,171 274.17 310.86 12.9
2 mentions1 same-page
Page ?Same page
1.200.000.00 1.000.000.00 800)300.00 600)300.00 O4' 4> 4' 4;9 4' 4,1' 4> 4> •4> 4,b scb t t 5) t 9 1.9 9 9 - NAV EFTA00293378 Atorus, LLC 2/18/2014 Largest Exposures 99th Percentile 1st Percentile (@ cost ex-MTM) Largest MTM Gains (95th Percentile MTM Gains % NAV) Security N
11 1,570 35.00 34.04 0.74 0.93% BHP US Equity 19 2,162 70.07 68.40 0.93 0.94% BIIB US Equity 361 1,066 333.21 329.19 23.14 1.46% BIL S.I Equity (196) (3,561) 32.41 31.92 -4.71 1.16% BK US Equity 60 1,539 31.80 31.81 4.50 0.86% BLK US Equity 127 1,171 305.30 303.93 11.69 0.
2 mentions1 same-page
Page ?Same page
6,000.00 1.600.000.00 1.400.000.00 1.200.000.00 1,000,000.00 600,000.00 600,000.00 "Zr" e e 4% 4 k N. 4' 4% N\''' 0,‘ —NAV EFTA00293442 Atorus, LLC 2/28/2014 Largest Exposures Current Positions 97.5th Percentile 2,Sst Percentile (@ cost ex- MTM) Largest MTM Gains Current Posi ions (90th
-0.66 0.96% (11.68) BHP US Equity 2 4,501 69.12 69.16 0.05 0.93% (4.09) BIIB US Equity 423 1,066 245.93 343.51 27.93 1.42% (2.84) BIL S.I Equity (43) 2,362 32.55 31.96 -1.68 1.09% BK US Equity 64 3,666 31.42 31.97 1.92 0.91% 31.72 BLK US Equity 136 1,171 274.17 306.12 11.78
Sponsored
2 mentions1 same-page
Page ?Same page
Short ■ EMEA Long ■ EMEA Short ■ AMER Long ■ AMER Short ■ EquityCom Long ■ EquityCom Short ■ G20 Rates Long ■ G20 Rates Short EFTA00293460 Atorus, LLC 3/3/2014 Historical Net Exposure by Geography (Listed Equities) & Macro (Equity Indices & Cornrow!Nees, G20 Gov. Credit) 2,000,000 1,500,000
0.98% (175.36) BHP US Equity (61) 4,501 69.11 68.18 -1.53 0.89% (62.38) BIIB US Equity 394 1,066 245.93 336.83 25.07 1.47% (28.37) BIL S.I Equity (122) 2,362 32.47 30.88 -4.33 1.19% (76.07) BK US Equity 42 3,723 31.43 31.78 1.22 0.92% (22.27) BLK US Equity 109 1,171 274.17 2
2 mentions1 same-page
Page ?Same page
Short ■ EMEA Long ■ EMEA Short ■ AMER Long ■ AMER Short ■ EquityCom Long ■ EquityCom Short ■ G20 Rates Long ■ G20 Rates Short EFTA00293428 Atorus, Lit 2/27/2014 Historical Net Exposure by Geography (Listed Equities) & Macro (Equity Indices & Comrnodiites, G20 Gov. Credit) 2,000,000 1,500,00
-0.42 0.97% (21.61) BHP US Equity 6 4,501 69.12 69.22 0.15 0.94% 4.92 BIIB US Equity 426 1,066 245.93 344.16 28.24 1.41% (12.86) BIL S.I Equity (54) 2,952 32.55 31.96 -1.55 1.18% 13.24 BK US Equity 39 2,921 31.29 31.70 1.46 0.91% 37.16 BLK US Equity 127 1,171 274.17 303.85
2 mentions1 same-page
Page ?Same page
000 11, •'V 'V 11, O•y 'V 3 3 3 3 3 3 4 b c 9S o 0.% etr 10. 19> etr1,0% eti\ti e 4 A\ .5\ „ 4 4,va At, 4 —Series]. EFTA00288463 Atorus, LLC 6/6/2014 Largest Exposures Current Positions 97.5th Percentile 2.5th Percentile (@ cost ex- MTM) Largest MTM Gains Current Posi ions (90th P
-2.22 0.93% 0.88 BHP US Equity (5) 7,278 68.00 67.95 -0.07 0.90% 46.32 BIIB US Equity 307 1,066 245.93 316.84 23.67 1.22% (10.61) BIL S.I Equity 98 (4,833) 32.51 31.85 2.91 0.70% (65.16) BK US Equity 603 8,609 32.86 35.16 9.16 0.76% 86.47 BLK US Equity 181 4,444 301.23 313.
Sponsored
Mutual Connections (28)
Entities connected to both Atorus and BIL S.I Equity
Ghislaine Maxwell
PERSON105 w/ Atorus·10 w/ BIL
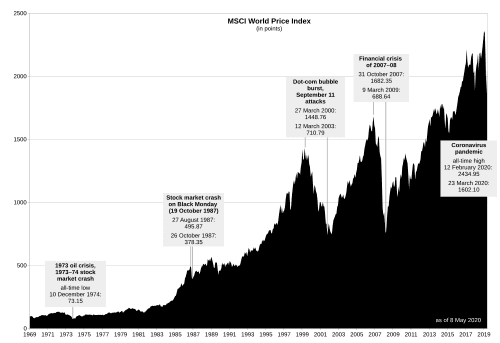
MSCI World
ORGANIZATION81 w/ Atorus·6 w/ BIL
ENI IM Equity
ORGANIZATION67 w/ Atorus·7 w/ BIL
AU TSY
ORGANIZATION65 w/ Atorus·5 w/ BIL
Current Portfolio -Listed Equity Portfolio
ORGANIZATION62 w/ Atorus·5 w/ BIL
MSCI World Change
ORGANIZATION56 w/ Atorus·5 w/ BIL
EquityCom
ORGANIZATION54 w/ Atorus·3 w/ BIL
SMSN LI Equity
ORGANIZATION45 w/ Atorus·5 w/ BIL
Largest MTM
ORGANIZATION23 w/ Atorus·3 w/ BIL
GE US Equity
ORGANIZATION23 w/ Atorus·2 w/ BIL
MCD US Equity
ORGANIZATION20 w/ Atorus·5 w/ BIL
BMW GR
ORGANIZATION22 w/ Atorus·2 w/ BIL
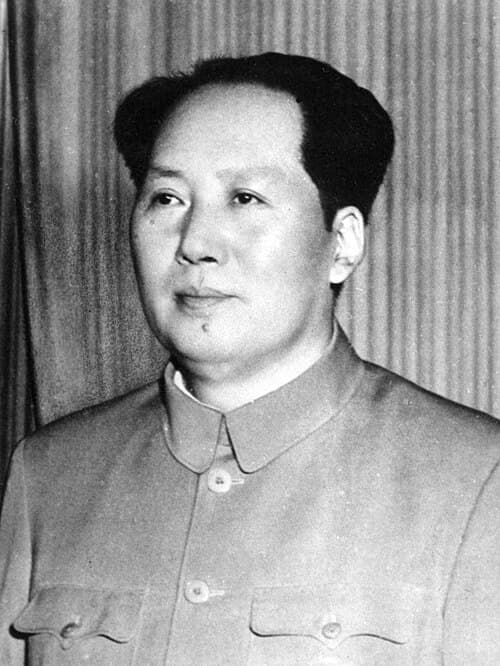
Mao Zedong
PERSON22 w/ Atorus·2 w/ BIL
Usted Equities) & Macro
ORGANIZATION15 w/ Atorus·2 w/ BIL
Usted Equities
ORGANIZATION14 w/ Atorus·2 w/ BIL
BIIB US Equity
ORGANIZATION10 w/ Atorus·6 w/ BIL
SU CN Equity
ORGANIZATION11 w/ Atorus·2 w/ BIL
SWEOA
ORGANIZATION11 w/ Atorus·2 w/ BIL
MOLZ US Equity
ORGANIZATION9 w/ Atorus·4 w/ BIL
STEICNZL
ORGANIZATION9 w/ Atorus·3 w/ BIL