Back to Network

9
Shared Docs
9
Same-Page
9 / 9
Mentions
Document Mentions (9 shared documents)
2 mentions1 same-page
Page ?Same page
0,000.00 c9 e e e <, ,„ ‘ct it Qg ct9 cfs e CP. e ab 4 ,%* 40 t co c, % '4 4 A‘ ,c)\ <,‘N — NAV EFTA_R1_02065371 EFTA02700187 Atorus, LLC 2/10/2014 Largest Exposures 99th Percentile 1st Percentile (€) cost ex-MTM) Largest MTM Gains (95th Percentile MTM Gains % NAV) Security
309) 31.86 32.60 -2.65 0.87% BHP US Equity (62) (2,216) 63.59 65.37 -3.22 0.87% Bile US Equity 297 1,045 245.93 315.84 20.45 1.39% BIL S1 Equity 121 (4,383) 30.51 29.67 2.71 1.02% 8K US Equity 43 1,526 30.62 31.49 3.34 0.85% BLK US Equity 101 1,152 276.10 300.22 9.27 0.94%
2 mentions1 same-page
Page ?Same page
e se . e % % (19 % C14% ee(Peeee % % % 4 % 4 % 4 (1. 4 #e 4 A\ 4 4 % 4 % s 4 A\ 4 4% 4 4 — NAV EFTA_R1_02067835 EFTA02700709 Atorus, LLC 2/11/2014 Largest Exposures 99th Percentile 1st Percentile (€) cost ex-MTM) largest MTM Gains (95th Percentile MTM Gains % NAV) Security
,614) 17.28 17.52 -0.98 1.39% BHP AU Equity (47) (1,233) 31.81 33.02 -4.27 0.89% BIM US Equity 310 1,065 245.93 317.60 20.37 1.43% BIL S1 Equity (6) (4,448) 30.26 30.30 -0.13 1.07% 8K US Equity 53 1,538 30.62 31.68 3.87 0.89% BLK US Equity 125 1,170 274.17 303.39 10.95 0.97
2 mentions1 same-page
Page ?Same page
.0D 800,000.0D 600,000.00 (so, „ct, ,„9, o4,1, A6» s.$) s,,t• , \v- - - 4% 0, 4, A\ oP 4ste 4% 4' 4' ts. •)›\ —NAV EFTA00293218 Atorus, LLC 3/18/2014 Largest Exposures Current Positions 97.5th Percentile 2.5th Percentile (@ cost ex- MTM) Largest MTM Gains Current Posi ions (90th
.36 1.21% 110.84 BHP US Equity (222) 6,839 67.70 65.58 -3.35 0.97% 39.00 61111 US Equity 456 1,066 245.93 351.10 32.01 1.34% 28.46 BIL S1 Equity 15 (2,643) 30.29 30.11 0.46 1.23% 0.12 BK US Equity 257 6,515 32.16 33.43 5.45 0.72% 9.84 BLK US Equity 112 1,171 274.17 300.49
Sponsored
2 mentions1 same-page
Page ?Same page
0.000) (3,000,000) Historical Gross Exposure by Geography (Listed Equities) & Macro (Equity Indices & Commodlites, G20 Gov. Credit) EFTA00288354 Atorus, LIC 5/21/2014 Current Gross Notional Risk by Category 246,534 6;8,412 1,517,13 • APAC • EMEA • AMER • EquityCom • G20 Rates Performance V
-1.42 0.85% (132.36) BHP US Equity 101 7,278 68.00 68.94 1.52 0.92% 20.62 BBB US Equity 206 1,066 245.93 293.57 12.73 1.52% 12.82 BIL S1 Equity 38 (2,997) 32.61 32.20 1.81 0.70% 12.11 BK US Equity 391 8,609 32.86 34.35 5.14 0.88% 92.72 BLK US Equity 20 2,324 297.25 299.83
2 mentions1 same-page
Page ?Same page
our volatility profile. O,~ et, n) ) ix OVA c 9%410.% 19% et, e cots et, cot, .voss. 4 At- 4 op 4' 4 .,4% 4's 4 SerieS1 1 EFTA00288447 Atorus, LLC 6/5/2014 Largest Exposures Current Positions 97.5th Percentile 2.5th Percentile (@ cost ex- MTM) Largest MTM Gains Current Posi ions (90th P
7 -2.16 0.96% 63.95 BHP US Equity (51) 7,278 67.99 67.52 -0.77 0.91% 21.82 BBB US Equity 318 1,066 245.93 319.30 24.19 1.23% 2.22 BIL S1 Equity 159 (4,833) 32.51 31.44 4.90 0.67% 24.89 BK US Equity 517 8,609 32.86 34.84 7.92 0.76% 43.85 BLK US Equity 125 3,931 299.70 309.2
2 mentions1 same-page
Page ?Same page
N N rn M rn in M M e !It C C 0 0 0 0 N N N N N N N N NI 0 O itS in in O itS in in IN in in N. NAV EFTA00288671 Atorus, LLC 8/8/2014 Largest Exposures Current Positions 97.5th Percentile 2.5th Percentile (@ cost ex- MTM) Largest MTM Gains Current Posi ions (90th P
4.18 0.68% (174.73) BHP US Equity 286 9,032 68.57 70.74 4.02 0.79% (6.74) BBB US Equity 365 1,066 241.05 323.68 27.22 1.26% 2.74 BIL S1 Equity 33.56 BK US Equity 1,728 11,358 33.36 38.44 20.28 0.75% (81.24) BLK US Equity (84) 7,520 309.47 306.06 -1.68 0.66% 60.51 BLT IN Equ
Sponsored
2 mentions1 same-page
Page ?Same page
000) (1,000,000) ( Historical Gross Exposure by Geography (Listed Equities) & Macro (Equity Indices & Commodlites, G20 Gov. Credit) EFTA00288867 Atorus, LIC 5/20/2014 Current Gross Notional Risk by Category 2S1,788 1 ,4,312 411 • APAC • EMEA • AMER • EquityCom • G20 Rates Performance Vs. M
.25 0.83% (125.60) BHP US Equity 81 7,278 68.00 68.75 1.14 0.97% (122.86) BOB US Equity 194 1,066 245.93 290.64 11.93 1.52% (1.22) BIL S1 Equity 26 (2,007) 32.75 32.32 1.79 0.72% 17.34 BK US Equity 299 8,609 32.86 34.00 4.03 0.86% (16.55) BLK US Equity 4 1,641 296.18 296.87
2 mentions1 same-page
Page ?Same page
,000,000.00 1)30,000.00 600 000 00 e e doe e e cis" e e e e Q Q et, et, t, Q, et, Q. 4 k cbt' 4se •» 4' 4 c5‘4 "S. — NAV EFTA00288111 Atorus, LLC 3/31/2014 Largest Exposures Current Positions 97.5th Percentile 2.5th Percentile (@ cost ex- MTM) Largest MTM Gains Current Posi ions (90th
0.96 1.25% 108.31 BHP US Equity (6) 6,839 67.77 67.71 -0.09 0.95% 21.38 6116 US Equity 253 1,066 245.93 304.25 15.41 1.54% 12.66 BIL S1 Equity (81) (2,643) 30.29 31.21 -2.73 1.12% (22.71) BK US Equity 642 8,609 32.86 35.31 8.86 0.84% 38.28 BLK US Equity 172 1,171 274.17 3
2 mentions1 same-page
Page ?Same page
00000 "1, 1, et, 1, 19% 19% Q> ei? CI' Obi Q> <)) °, b eiP \ Vi c> os, A % 4' 4 <,P \%\ 4S' et' ,St• 99 c —NAV EFTA00288175 Atorus, LLC 4/4/2014 Largest Exposures Current Positions 97.5th Percentile 2.5th Percentile (@ cost ex- MTM) Largest MTM Gains Current Posi ions (90th P
2 1.38 1.24% 54.33 BHP US Equity 262 6,839 67.77 70.37 3.91 0.98% 92.44 BOB US Equity 198 1,066 245.93 291.70 11.53 1.61% (40.21) BIL S1 Equity (150) (2,114) 30.29 32.44 .6.23 1.14% (33.24) BK US Equity 546 8,609 32.86 34.95 8.16 0.78% (87.83) BLK US Equity 169 1,171 274.17
Sponsored
Mutual Connections (26)
Entities connected to both Atorus and BIL S1 Equity
Ghislaine Maxwell
PERSON105 w/ Atorus·11 w/ BIL
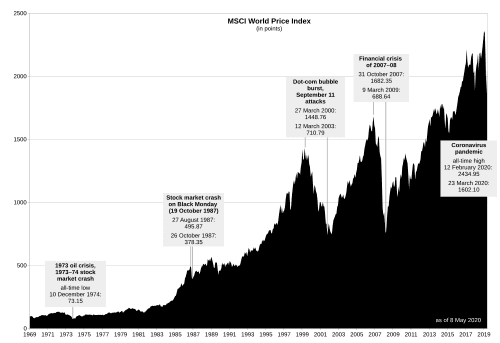
MSCI World
ORGANIZATION81 w/ Atorus·8 w/ BIL
ENI IM Equity
ORGANIZATION67 w/ Atorus·5 w/ BIL
AU TSY
ORGANIZATION65 w/ Atorus·6 w/ BIL
Current Portfolio -Listed Equity Portfolio
ORGANIZATION62 w/ Atorus·6 w/ BIL
MSCI World Change
ORGANIZATION56 w/ Atorus·5 w/ BIL
EquityCom
ORGANIZATION54 w/ Atorus·4 w/ BIL
SMSN LI Equity
ORGANIZATION45 w/ Atorus·5 w/ BIL
Emmanuel Macron
PERSON39 w/ Atorus·4 w/ BIL
Largest Exposures Current
ORGANIZATION23 w/ Atorus·3 w/ BIL
GE US Equity
ORGANIZATION23 w/ Atorus·2 w/ BIL
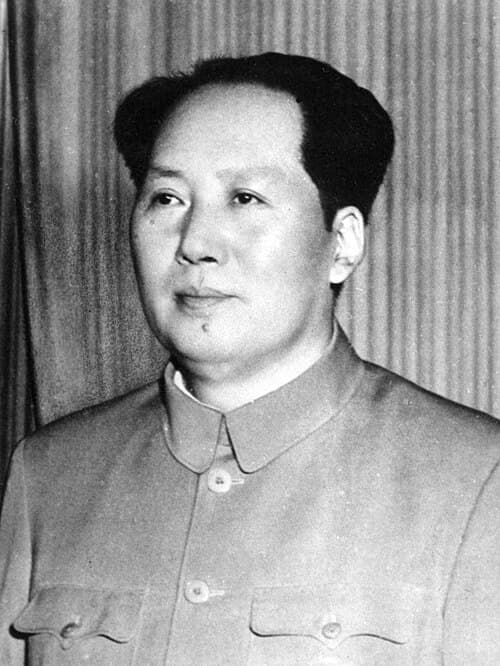
Mao Zedong
PERSON22 w/ Atorus·3 w/ BIL
BMW GR
ORGANIZATION22 w/ Atorus·2 w/ BIL
Sharpe
ORGANIZATION19 w/ Atorus·2 w/ BIL
Usted Equities) & Macro
ORGANIZATION15 w/ Atorus·2 w/ BIL
BCS US Equity
ORGANIZATION13 w/ Atorus·3 w/ BIL
Usted Equities
ORGANIZATION14 w/ Atorus·2 w/ BIL
Position (ex-99pct & ex-lst
ORGANIZATION13 w/ Atorus·2 w/ BIL
AMZN US Equity
ORGANIZATION11 w/ Atorus·3 w/ BIL
SU CN Equity
ORGANIZATION11 w/ Atorus·2 w/ BIL