Back to Network

9
Shared Docs
9
Same-Page
9 / 9
Mentions
Document Mentions (9 shared documents)
2 mentions1 same-page
Page ?Same page
on 64 EquityCom Short 8 G20 Rates Lon 15 G20 Rates Short 8 Total Long 346 Total Short 104 Current Exposure by Geography (Listed Equl les) & Macro (Equity Indices & Commodiites, G20 Gov. Credit) $2,000,000 $1,500,000 $1,000,000 $500,000 5(500,000) $(1,000,000) 1 ■ APAC Long ■ APAC S
14.62 1.01% (0.27) SIE GR Equity 780 5,345 114.81 131.56 15.01 0.97% 33.62 SLB US Equity 872 6,528 79.94 90.62 17.58 0.76% (0.23) SMSN LI Equity 539 (7,260) 644.51 596.64 7.88 0.94% 40.12 SO US Equity (7) 1,673 43.26 43.08 .0.87 0.48% (16.36) SPG US Equity 16 3,590 160.18 1
2 mentions1 same-page
Page ?Same page
n 62 EquityCom Short 10 G20 Rates Lon 15 G20 Rates Short 8 Total Long 337 Total Short 112 Current Exposure by Geography (Listed Equl les) & Macro (Equity Indices & Commodiites, G20 Gov. Credit) $2,000,000 $1,500,000 $1,000,000 $500,000 5- 5(500,000) 5(1,000,000) i 1 • APAC Long • AP
15.64 1.07% 56.99 SIE GR Equity 883 5,345 114.81 133.78 16.82 0.98% 18.37 SLB US Equity 1,258 6,528 79.94 95.35 24.31 0.79% 128.27 SMSN LI Equity 744 (7,260) 644.51 578.48 12.29 0.83% 130.36 SO US Equity 34 5,537 43.08 43.34 1.11 0.55% 28.16 SPG US Equity 7 1,832 160.84 161.
Sponsored
2 mentions1 same-page
Page ?Same page
n 60 EquityCom Short 10 G20 Rates Lon 15 G20 Rates Short 8 Total Long 333 Total Short 112 Current Exposure by Geography (Listed Equl les) & Macro (Equity Indices & Commodiites, G20 Gov. Credit) $2,000,000 $1,500,000 $1,000,000 $500,000 5 5(500,000) 5(1,000,000) i 1 • APAC Long • AP
92 1.04% (65.98) SIE GR Equity 865 5,345 114.81 133.39 16.39 0.99% (51.68) SLB US Equity 1,132 6,528 79.94 93.80 23.26 0.75% 88.85 SMSN LI Equity 636 (7,260) 644.51 588.06 9.85 0.89% 1.06 SO US Equity 11 4,573 43.02 43.12 0.43 0.54% 11.38 SPG US Equity (0) 897 160.18 160.12
2 mentions1 same-page
Page ?Same page
on 63 EquityCom Short 8 G20 Rates Lon 15 G20 Rates Short 8 Total Long 338 Total Short 104 Current Exposure by Geography (Listed Equl les) & Macro (Equity Indices & Commodiites, G20 Gov. Credit) $2,000,000 $1,500,000 $1,000,000 $500,000 5- 5(500,000) $(1,000,000) i • APAC Long • APAC Sh
13.36 1.01% 188.44 SIE GR Equity 711 5,345 114.81 130.09 13.49 0.99% 251.01 SLB US Equity 785 6,528 79.94 89.56 15.13 0.79% 8.41 SMSN LI Equity 537 (7,260) 644.51 596.83 7.52 0.98% (41.25) SO US Equity - 43.52 0.53% SPG US Equity 70 4,487 160.18 162.67 2.41 0.65% 33.95 SRE
2 mentions1 same-page
Page ?Same page
ng 63 EquityCom Short 9 G20 Rates Long 19 G20 Rates Short 4 Total Long 352 Total Short 91 Current Exposure by Geography (Listed Equl les) & Macro (Equity Indices & Commodiites, G20 Gov. Credit) $2,000,000 $1,500,000 $1,000,000 $500,000 $ $(500,000) mi ■ APAC Long ■ APAC Short ■ EMEA Lo
S Equity 784 5,671 RN/A N/A 13.30 1.04% SIE GR Equity 895 5,345 RN/A N/A 18.40 0.91% SLB US Equity 1,661 7,697 RN/A N/A 31.64 0.68% SMSN LI Equity (102) (6,021) RN/A N/A -1.58 1.07% SO US Equity 355 9,151 RN/A N/A 6.26 0.62% SPG US Equity 189 7,477 RN/A N/A 4.21 0.60% SREN VX E
Sponsored
2 mentions1 same-page
Page ?Same page
Lon 64 EquityCom Short 8 G20 Rates Lon 19 G20 Rates Short 4 Total Long 354 Total Short 87 Current Exposure by Geography (Listed Equl les) & Macro (Equity Indices & Commodiites, G20 Gov. Credit) $2,000,000 $1,500,000 $1,000,000 $500,000 $ $(500,000) 1 ■ APAC Long ■ APAC Short ■ EMEA Lo
36.26 15.62 0.96% 41.99 SIE GR Equity 980 5,345 114.81 135.86 20.35 0.90% SLB US Equity 1,839 8,221 83.35 101.99 30.69 0.73% 40.72 SMSN LI Equity (135) (6,021) 643.80 658.21 -2.10 1.07% SO US Equity 348 9,151 43.58 45.24 6.29 0.61% 23.49 SPG US Equity 221 8,178 166.14 170.62
2 mentions1 same-page
Page ?Same page
Lon 64 EquityCom Short 8 G20 Rates Lon 21 G20 Rates Short 2 Total Long 365 Total Short 73 Current Exposure by Geography (Listed Equl les) & Macro (Equity Indices & Commodiites, G20 Gov. Credit) 1 ■ APAC Long ■ APAC Short ■ EMEA Long ■ EMEA Short ■ AMER Long ■ AMER Short ■ EquityCom Long
09 0.85% SI US Equity #N/A N/A SIE GR Equity 747 5,345 114.81 130.85 15.49 0.90% SLB US Equity 1,780 8,679 84.17 101.42 32.75 0.63% SMSN LI Equity (26) 4,757 696.61 692.78 -0.57 0.97% SO US Equity (262) 11,861 44.09 43.14 -3.41 0.65% SPG US Equity 457 12,778 168.98 175.03 9.59
2 mentions1 same-page
Page ?Same page
Lon 64 EquityCom Short 8 G20 Rates Lon 21 G20 Rates Short 1 Total Long 365 Total Short 76 Current Exposure by Geography (Listed Equl les) & Macro (Equity Indices & Commodiites, G20 Gov. Credit) 1 ■ APAC Long ■ APAC Short ■ EMEA Long ■ EMEA Short ■ AMER Long ■ AMER Short ■ EquityCom Long
N/A 16.39 0.83% SIE GR Equity 704 5,345 114.81 129.93 14.95 0.88% (59.30) SLB US Equity 1,679 8,679 84.17 100.45 31.71 0.61% 44.55 SMSN LI Equity 32 2,474 698.82 707.99 1.42 0.92% 32.02 SO US Equity (355) 11,861 44.07 42.79 -4.55 0.66% (55.36) SPG US Equity 482 12,778 168.98
Sponsored
Mutual Connections (38)
Entities connected to both Emmanuel Macron and SMSN LI Equity
Ghislaine Maxwell
PERSON130 w/ Emmanuel·51 w/ SMSN
AT
Atorus
PERSON39 w/ Emmanuel·45 w/ SMSN
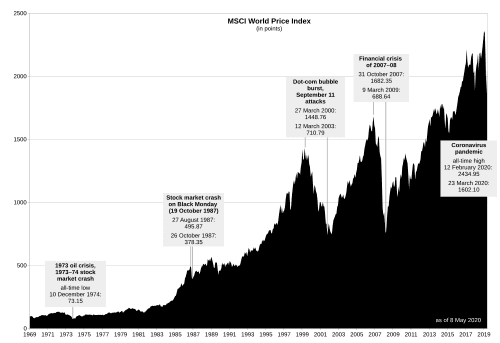
MSCI World
ORGANIZATION31 w/ Emmanuel·34 w/ SMSN
ENI IM Equity
ORGANIZATION23 w/ Emmanuel·38 w/ SMSN
AU TSY
ORGANIZATION32 w/ Emmanuel·25 w/ SMSN
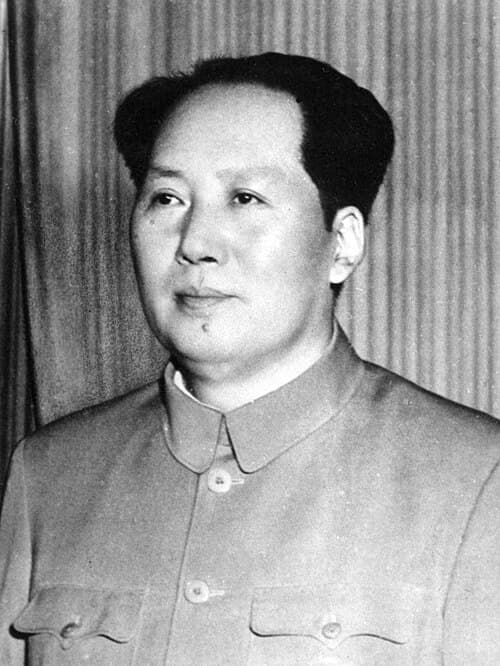
Mao Zedong
PERSON38 w/ Emmanuel·15 w/ SMSN
Current Portfolio -Listed Equity Portfolio
ORGANIZATION23 w/ Emmanuel·29 w/ SMSN
MSCI World Change
ORGANIZATION32 w/ Emmanuel·19 w/ SMSN
EquityCom
ORGANIZATION29 w/ Emmanuel·16 w/ SMSN
GE US Equity
ORGANIZATION10 w/ Emmanuel·13 w/ SMSN
SAS LN Equity
ORGANIZATION11 w/ Emmanuel·5 w/ SMSN
Largest Exposures Current
ORGANIZATION12 w/ Emmanuel·3 w/ SMSN
BMW GR
ORGANIZATION12 w/ Emmanuel·3 w/ SMSN
AMZN US Equity
ORGANIZATION8 w/ Emmanuel·5 w/ SMSN
MCD US Equity
ORGANIZATION7 w/ Emmanuel·6 w/ SMSN
MCK US Equity
ORGANIZATION6 w/ Emmanuel·6 w/ SMSN
BCS US Equity
ORGANIZATION4 w/ Emmanuel·6 w/ SMSN
EquityCorn
ORGANIZATION6 w/ Emmanuel·3 w/ SMSN
BIL S1 Equity
ORGANIZATION4 w/ Emmanuel·5 w/ SMSN
EMEA Long
ORGANIZATION4 w/ Emmanuel·5 w/ SMSN