Back to Network

8
Shared Docs
8
Same-Page
8 / 8
Mentions
Document Mentions (8 shared documents)
2 mentions1 same-page
Page ?Same page
ng 63 EquityCom Short 9 G20 Rates Long 19 G20 Rates Short 4 Total Long 352 Total Short 91 Current Exposure by Geography (Listed Equl les) & Macro (Equity Indices & Commodiites, G20 Gov. Credit) $2,000,000 $1,500,000 $1,000,000 $500,000 $ $(500,000) mi ■ APAC Long ■ APAC Short ■ EMEA Lo
IX Equity • 1,115 #N/A N/A 0.00 032% AMGN US Equity 5,201 22,886 #N/A N/A 20.02 1.13% AMT US Equity 890 10,655 #N/A N/A 14.43 0.58% AMZN US Equity 11 (4,757) RN/A N/A 0.17 1.33% ANZ AU Equity 526 7,345 RN/A N/A 9.40 036% APA US Equity (124) (5,496) #N/A N/A .3.29 0.69% APC US E
2 mentions1 same-page
Page ?Same page
ng 63 EquityCom Short 8 G20 Rates Long 19 G20 Rates Short 4 Total Long 357 Total Short 86 Current Exposure by Geography (Listed Equl les) & Macro (Equity Indices & Commodiites, G20 Gov. Credit) $2,000,000 i $1,500,000 51,000,000 5500,000 $ $(500,000) 1 mi ■ APAC Long ■ APAC Short ■ EME
9.11 2.06 0.74% 44.59 AMGN US Equity 4,596 22,886 94.49 113.46 16.40 1.22% AMT US Equity 1,046 10,655 76.29 83.78 17.60 0.56% 4.02 AMZN US Equity 1 (1,189) 326.05 325.89 0.03 1.44% 22.96 ANZ AU Equity 646 7,345 29.47 32.06 11.48 0.77% 6.41 APA US Equity (248) (4,122) 82.74 8
2 mentions1 same-page
Page ?Same page
Lon 64 EquityCom Short 7 G20 Rates Lon 22 G20 Rates Short 1 Total Long 365 Total Short 72 Current Exposure by Geography (Listed Equl les) & Macro (Equity Indices & Commodiites, G20 Gov. Credit) $2,000,000 $1,500,000 $1,000,000 5500,000 $(500,000) ■ APAC Long ■ APAC Short ■ EMEA Long ■
98 0.74% 13.83 AMGN US Equity (5) (825) 114.07 114.82 -0.67 0.98% (11.50) AMT US Equity 1,724 12,212 77.60 88.56 23.48 0.60% 43.85 AMZN US Equity 18 (2,898) 307.87 305.94 0.34 1.83% (12.99) ANZ AU Equity 184 12,947 30.37 30.80 1.77 0.80% 260.45 APA US Equity 152 4,994 87.75
Sponsored
2 mentions1 same-page
Page ?Same page
ng 65 EquityCom Short 7 G20 Rates Long 19 620 Rates Short 4 Total Long 373 Total Short 66 Current Exposure by Geography (Listed Equl les) & Macro (Equity Indices & Commodiites, G20 Gov. Credit) $2,500,000 $2,000,000 $1,500,000 $1,000,000 $500,000 $- $(500,000) ■ APAC Long ■ APAC Sho
87 0.59% 10.20 AMGN US Equity 41 7,345 116.07 116.72 0.83 0.68% (58.78) AMT US Equity 1,951 12,212 77.36 89.71 27.16 0.59% (86.20) AMZN US Equity (210) (2,898) 306.51 328.76 4.46 1.63% (0.97) ANZ AU Equity 673 12,947 #N/A N/A 7.49 0.69% APA US Equity 519 8,740 89.57 94.89 9.0
2 mentions1 same-page
Page ?Same page
ng 65 EquityCom Short 7 G20 Rates Long 21 G20 Rates Short 2 Total Long 376 Total Short 59 Current Exposure by Geography (Listed Equl les) & Macro (Equity Indices & Commodiites, G20 Gov. Credit) $2,500,000 $2,000,000 $1,500,000 $1,000,000 $500,000 $- $(500,000) ■ APAC Long ■ APAC Sho
-0.88 0.40% 10.87 AMGN US Equity 292 8,878 116.15 119.98 5.13 0.64% 107.50 AMT US Equity 1,961 13,044 77.99 89.71 33.17 0.45% 4.99 AMZN US Equity (228) (2,898) 306.51 330.63 -6.86 1.15% (52.32) ANZ AU Equity 709 12,947 29.78 31.41 7.73 0.71% (45.55) APA US Equity 1,198 12,393
2 mentions1 same-page
Page ?Same page
ng 67 EquityCom Short 5 G20 Rates Long 19 G20 Rates Short 4 Total Long 377 Total Short 58 Current Exposure by Geography (Listed Equl les) & Macro (Equity Indices & Commodiites, G20 Gov. Credit) $2,500,000 $2,000,000 $1,500,000 $1,000,000 $500,000 $(500,000) ■ APAC Long ■ APAC Short
61 0.52% 21.01 AMGN US Equity (1) 8,878 116.15 116.14 -0.01 0.58% 25.14 AMT US Equity 1,658 12,312 77.43 87.86 27.10 0.50% (57.86) AMZN US Equity (184) (2,898) 306.51 325.99 -5.16 1.23% 3.30 ANZ AU Equity 920 12,947 29.78 31.89 9.77 0.73% 98.39 APA US Equity 851 10,988 90.94
Sponsored
2 mentions1 same-page
Page ?Same page
Lon 64 EquityCom Short 8 G20 Rates Lon 21 G20 Rates Short 2 Total Long 358 Total Short 82 Current Exposure by Geography (Listed Equl les) & Macro (Equity Indices & Commodiites, G20 Gov. Credit) $2,000,000 i $1,500,000 $1,000,000 $500,000 $ $(500,000) ■ APAC Long ■ APAC Short ■ EMEA Lo
0.72% 26.70 AMGN US Equity 23 (4,127) 112.50 111.86 0.52 1.07% (51.43) AMT US Equity 1,734 11,678 76.91 88.33 24.86 0.60% (12.73) AMZN US Equity 77 (3,623) 306.51 299.98 1.08 1.97% (138.09) ANZ AU Equity 361 12,947 29.78 30.61 3.69 0.76% (35.13) APA US Equity 130 4,994 87.41
2 mentions1 same-page
Page ?Same page
Lon 64 EquityCom Short 8 G20 Rates Lon 21 G20 Rates Short 1 Total Long 365 Total Short 76 Current Exposure by Geography (Listed Equl les) & Macro (Equity Indices & Commodiites, G20 Gov. Credit) 1 ■ APAC Long ■ APAC Short ■ EMEA Long ■ EMEA Short ■ AMER Long ■ AMER Short ■ EquityCom Long
95 0.78% 17.76 AMGN US Equity 4 (1,651) 112.50 112.23 0.26 0.92% (1.76) AMT US Equity 1,658 12,212 77.36 87.86 22.47 0.60% (24.24) AMZN US Equity 52 (2,898) 306.51 300.98 0.97 1.87% (44.05) ANZ AU Equity 220 12,947 29.78 30.28 2.23 0.76% (105.67) APA US Equity 131 4,994 87.41
Sponsored
Mutual Connections (26)
Entities connected to both Emmanuel Macron and AMZN US Equity
Ghislaine Maxwell
PERSON130 w/ Emmanuel·14 w/ AMZN
AT
Atorus
PERSON39 w/ Emmanuel·11 w/ AMZN
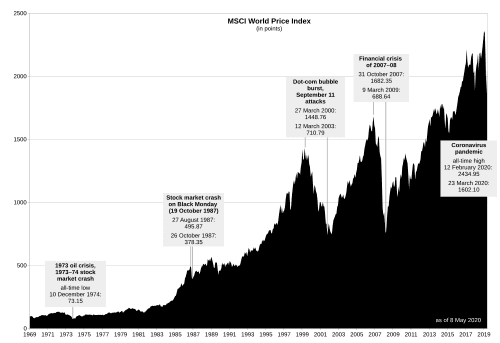
MSCI World
ORGANIZATION31 w/ Emmanuel·12 w/ AMZN
AU TSY
ORGANIZATION32 w/ Emmanuel·9 w/ AMZN
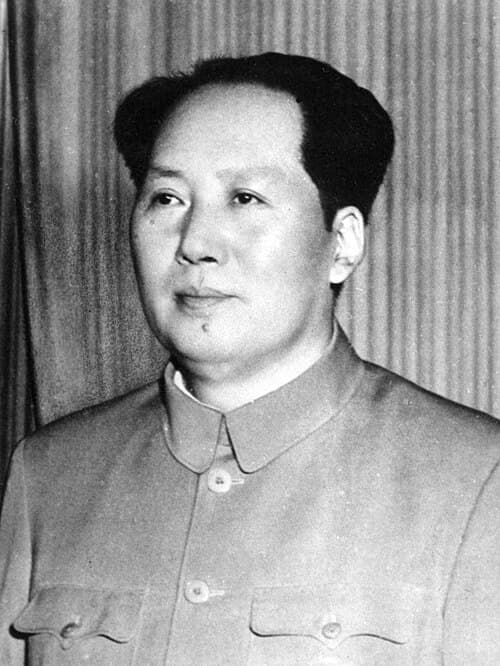
Mao Zedong
PERSON38 w/ Emmanuel·3 w/ AMZN
EquityCom
ORGANIZATION29 w/ Emmanuel·11 w/ AMZN
MSCI World Change
ORGANIZATION32 w/ Emmanuel·8 w/ AMZN
Current Portfolio -Listed Equity Portfolio
ORGANIZATION23 w/ Emmanuel·9 w/ AMZN
ENI IM Equity
ORGANIZATION23 w/ Emmanuel·6 w/ AMZN
SAS LN Equity
ORGANIZATION11 w/ Emmanuel·5 w/ AMZN
Largest Exposures Current
ORGANIZATION12 w/ Emmanuel·3 w/ AMZN
Sharpe
ORGANIZATION10 w/ Emmanuel·5 w/ AMZN
SMSN LI Equity
ORGANIZATION9 w/ Emmanuel·5 w/ AMZN
BMW GR
ORGANIZATION12 w/ Emmanuel·2 w/ AMZN
CBS US Equity
ORGANIZATION6 w/ Emmanuel·6 w/ AMZN
MCD US Equity
ORGANIZATION7 w/ Emmanuel·4 w/ AMZN
NexEposule
ORGANIZATION6 w/ Emmanuel·2 w/ AMZN
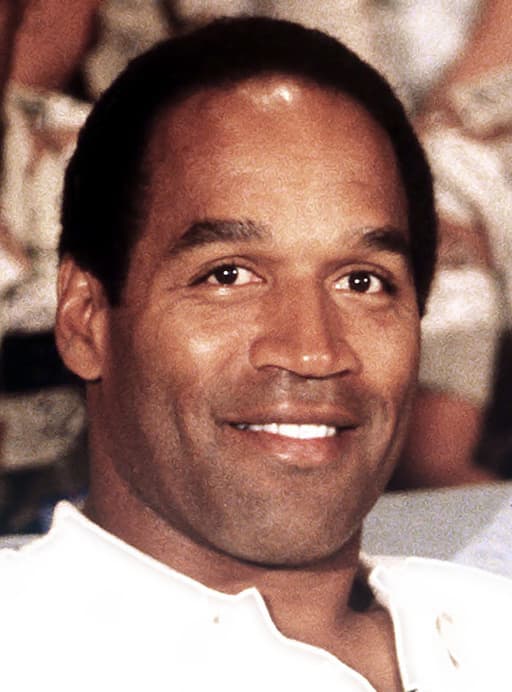
O.J. Simpson
PERSON6 w/ Emmanuel·2 w/ AMZN
BIL S1 Equity
ORGANIZATION4 w/ Emmanuel·3 w/ AMZN
BCS US Equity
ORGANIZATION4 w/ Emmanuel·3 w/ AMZN