Back to Network

10
Shared Docs
10
Same-Page
10 / 10
Mentions
Document Mentions (10 shared documents)
2 mentions1 same-page
Page ?Same page
Lon 65 EquityCom Short 7 G20 Rates Lon 21 G20 Rates Short 2 Total Long 365 Total Short 77 Current Exposure by Geography (Listed Equl les) & Macro (Equity Indices & Commodiites, G20 Gov. Credit) $2,000,000 $1,500,000 $1,000,000 $500,000 $(500,000) 1 ■ APAC Long ■ APAC Short ■ EMEA Long
1.75 1.24% 25.85 FP FP Equity 2,017 14,528 62.63 71.33 19.07 0.73% 75.62 G IM Equity (47) 4,486 21.99 21.76 -1.32 0.79% (135.21) GE US Equity 2,523 13,140 22.32 26.60 36.23 0.53% 19.87 GILD US Equity 230 4,205 77.50 81.75 3.92 1.40% 85.94 GIS US Equity 1,432 21,798 50.35
2 mentions1 same-page
Page ?Same page
Lon 64 EquityCom Short 8 G20 Rates Lon 16 G20 Rates Short 7 Total Long 356 Total Short 87 Current Exposure by Geography (Listed Equl les) & Macro (Equity Indices & Commodiites, G20 Gov. Credit) $2,000,000 $1,500,000 $1,000,000 5500,000 $ $(500,000) 1 ■ APAC Long ■ APAC Short ■ EMEA Lo
(61) 3,236 32.96 32.35 •1.64 1.15% 36.00 FP FP Equity 1,988 13,022 #N/A N/A 20.44 0.75% G IM Equity 363 5,030 #WA N/A 9.47 0.76% GE US Equity 2,597 13,140 22.32 26.73 37.64 0.53% (60.76) GILD US Equity 95 2,407 76.09 79.11 2.07 1.91% 54.91 GIS US Equity 1,042 19,548 50.02
2 mentions1 same-page
Page ?Same page
on 63 EquityCom Short 8 G20 Rates Lon 15 G20 Rates Short 8 Total Long 338 Total Short 104 Current Exposure by Geography (Listed Equl les) & Macro (Equity Indices & Commodiites, G20 Gov. Credit) $2,000,000 $1,500,000 $1,000,000 $500,000 5- 5(500,000) $(1,000,000) i • APAC Long • APAC Sh
32.44 .2.26 0.94% 28.39 FP FP Equity 687 11,013 60.83 64.62 8.40 0.74% 142.48 G IM Equity 228 4,486 21.32 22.40 5.63 0.90% 44.22 GE US Equity 1,842 13,140 22.32 25.45 16.01 0.88% 145.00 GILD US Equity 29,885 13,861 24.02 75.83 181.47 1.19% 104.50 GIS US Equity 323 13,333
Sponsored
2 mentions1 same-page
Page ?Same page
Lon 64 EquityCom Short 8 G20 Rates Lon 19 G20 Rates Short 4 Total Long 354 Total Short 87 Current Exposure by Geography (Listed Equl les) & Macro (Equity Indices & Commodiites, G20 Gov. Credit) $2,000,000 $1,500,000 $1,000,000 $500,000 $ $(500,000) 1 ■ APAC Long ■ APAC Short ■ EMEA Lo
,236 32.97 32.90 -0.19 1.19% 43.93 FP FP Equity 1,408 13,022 61.76 68.44 16.01 0.68% G IM Equity 252 4,069 21.51 22.85 8.16 0.76% GE US Equity 2,569 13,140 22.32 26.68 31.18 0.63% 34.46 GILD US Equity (95) (1,095) 67.41 73.23 -4.81 1.80% (33.23) GIS US Equity 899 17,619 49
2 mentions1 same-page
Page ?Same page
ng 64 EquityCom Short 8 G20 Rates Long 21 G20 Rates Short 2 Total Long 364 Total Short 71 Current Exposure by Geography (Listed Equl les) & Macro (Equity Indices & Commodiites, G20 Gov. Credit) $2,000,000 $1,500,000 $1,000,000 $500,000 $(500,000) 1 1 • APAC Long • APAC Short • EMEA Long
.32 4.82 1.01% 57.62 FP FP Equity 1,809 14,528 62.63 70.43 18.60 0.67% (11.20) G IM Equity 54 5,340 22.35 22.58 1.28 0.79% (4.03) GE US Equity 2,562 13,140 22.32 26.67 39.70 0.49% 21.11 GILD US Equity 253 4,205 77.50 82.16 4.84 1.24% (9.06) GIS US Equity 1,830 23,244 50.54
2 mentions1 same-page
Page ?Same page
Lon 65 EquityCom Short 7 G20 Rates Lon 21 G20 Rates Short 2 Total Long 365 Total Short 77 Current Exposure by Geography (Listed Equl les) & Macro (Equity Indices & Commodiites, G20 Gov. Credit) $2,000,000 $1,500,000 $1,000,000 $500,000 $(500,000) 1 ■ APAC Long ■ APAC Short ■ EMEA Long
1.75 1.24% 25.85 FP FP Equity 2,017 14,528 62.63 71.33 19.07 0.73% 75.62 G IM Equity (47) 4,486 21.99 21.76 -1.32 0.79% (135.21) GE US Equity 2,523 13,140 22.32 26.60 36.23 0.53% 19.87 GILD US Equity 230 4,205 77.50 81.75 3.92 1.40% 85.94 GIS US Equity 1,432 21,798 50.35
Sponsored
2 mentions1 same-page
Page ?Same page
Lon 64 EquityCom Short 8 G20 Rates Lon 21 G20 Rates Short 2 Total Long 361 Total Short 81 Current Exposure by Geography (Listed Equl les) & Macro (Eq ity Indices & Commodiites, G20 Gov. Credit) $2,000,000 $1,500,000 $1,000,000 $500,000 $(500,000) ■ APAC Long ■ APAC Short ■ EMEA Long ■
4.03 1.34% (24.32) FP FP Equity 1,961 14,528 62.63 71.09 19.38 0.70% (183.49) G IM Equity 171 5,607 21.99 22.67 4.33 0.71% (56.72) GE US Equity 2,685 13,140 22.32 26.88 38.97 0.52% 86.14 GILD US Equity 156 4,205 77.50 80.38 2.42 1.54% 9.24 GIS US Equity 1,737 21,315 50.27
2 mentions1 same-page
Page ?Same page
on 64 EquityCom Short 8 G20 Rates Lon 21. G20 Rates Short 2 Total Long 362 Total Short 80 Current Exposure by Geography (Listed Equl les) & Macro (Equity Indices & Commodiites, G20 Gov. Credit) $2,000,000 $1,500,000 $1,000,000 $500,000 $(500,000) 1 ■ APAC Long ■ APAC Short ■ EMEA Long
46 2.51 1.31% (69.16) FP FP Equity 1,966 14,528 62.63 71.11 19.88 0.68% 4.36 G IM Equity 156 5,607 21.99 22.61 4.09 0.68% (15.18) GE US Equity 2,651 13,140 22.32 26.82 38.53 0.52% (33.49) GILD US Equity 175 4,205 77.50 80.74 2.95 1.42% 19.29 GIS US Equity 1,646 21,798 50.3
2 mentions1 same-page
Page ?Same page
Lon 64 EquityCom Short 8 G20 Rates Lon 21 G20 Rates Short 1 Total Long 365 Total Short 76 Current Exposure by Geography (Listed Equl les) & Macro (Equity Indices & Commodiites, G20 Gov. Credit) 1 ■ APAC Long ■ APAC Short ■ EMEA Long ■ EMEA Short ■ AMER Long ■ AMER Short ■ EquityCom Long
2.18 1.12% 10.90 FP FP Equity 1,842 14,528 62.63 70.57 16.67 0.76% (172.60) G IM Equity (46) 3,364 21.99 21.69 .1.88 0.72% (10.70) GE US Equity 2,369 13,140 22.32 26.34 34.15 0.53% (152.40) GILD US Equity 220 4,205 77.50 81.56 3.81 1.37% (10.33) GIS US Equity 1,343 21,798 5
Sponsored
2 mentions1 same-page
Page ?Same page
61. EquityCom Short 11. G20 Rates Lon 16 G20 Rates Short 7 Total Long 345 Total Short 103 Current Exposure by Geography (Listed Equl les) & Macro (Equity Indices & Commodiites, G20 Gov. Credit) $2,000,000 $1,500,000 $1,000,000 $500,000 $(500,000) $(1,000,000) ■ APAC Long ■ APAC Short ■
32.76 -1.22 0.96% 82.67 FP FP Equity 936 11,013 60.83 65.99 11.59 0.73% 30.44 G IM Equity 186 3,588 21.32 22.42 6.38 0.81% 7.86 GE US Equity 2,078 13,140 22.32 25.85 20.86 0.76% (35.07) GILD US Equity 17,045 8,316 24.02 73.27 139.32 1.47% 1,039.83 GIS US Equity 700 15,048
Sponsored
Mutual Connections (33)
Entities connected to both Emmanuel Macron and GE US Equity
Ghislaine Maxwell
PERSON130 w/ Emmanuel·24 w/ GE
AT
Atorus
PERSON39 w/ Emmanuel·23 w/ GE
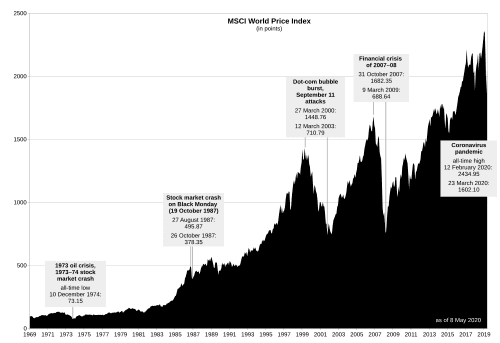
MSCI World Change
ORGANIZATION32 w/ Emmanuel·16 w/ GE
MSCI World
ORGANIZATION31 w/ Emmanuel·15 w/ GE
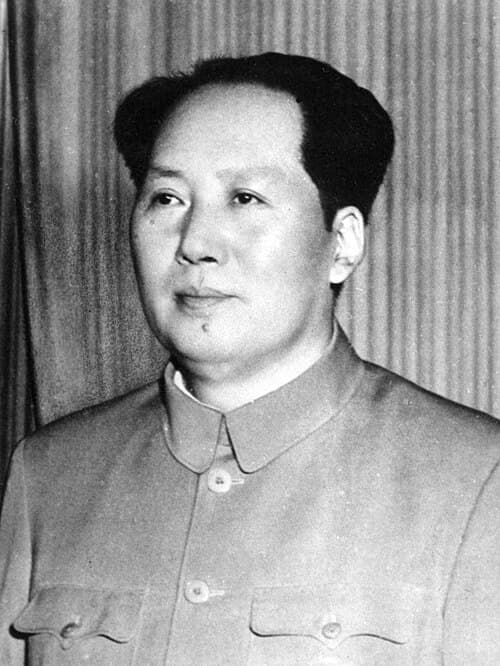
Mao Zedong
PERSON38 w/ Emmanuel·8 w/ GE
AU TSY
ORGANIZATION32 w/ Emmanuel·13 w/ GE
EquityCom
ORGANIZATION29 w/ Emmanuel·10 w/ GE
Current Portfolio -Listed Equity Portfolio
ORGANIZATION23 w/ Emmanuel·13 w/ GE
ENI IM Equity
ORGANIZATION23 w/ Emmanuel·13 w/ GE
SMSN LI Equity
ORGANIZATION9 w/ Emmanuel·13 w/ GE
BMW GR
ORGANIZATION12 w/ Emmanuel·7 w/ GE
Largest Exposures Current
ORGANIZATION12 w/ Emmanuel·5 w/ GE
SAS LN Equity
ORGANIZATION11 w/ Emmanuel·5 w/ GE
MCK US Equity
ORGANIZATION6 w/ Emmanuel·7 w/ GE
MCD US Equity
ORGANIZATION7 w/ Emmanuel·5 w/ GE
Position (ex-99pct & ex-lst
ORGANIZATION8 w/ Emmanuel·3 w/ GE
TYC US Equity
ORGANIZATION4 w/ Emmanuel·5 w/ GE
EquityCorn
ORGANIZATION6 w/ Emmanuel·3 w/ GE
BCS US Equity
ORGANIZATION4 w/ Emmanuel·3 w/ GE
BBD US Equity
ORGANIZATION4 w/ Emmanuel·2 w/ GE