Back to Network
8
Shared Docs
8
Same-Page
8 / 8
Mentions
Document Mentions (8 shared documents)
2 mentions1 same-page
Page ?Same page
8% SGO FP Equity 7,716 55.80 0.87% SI US Equity 11,251 128.89 0.79% SIE GR Equity 8,901 128.73 0.77% SLB US Equity 6,526 90.20 0.82% SMSN LI Equity 417 (7,254) 644.51 607.42 6.15 0.94% SO US Equity (77) (9,006) 41.73 42.09 -1.66 0.52% SPG US Equity (146) (3,011) 151.46 158.82 -
Historical Net Exposure by Geography (Usted Equities) & Macro (Equity indkes & Commodlites, G20 Gov. Credit) Historical Gross Exposure by Geography (Usted Equities) & Maao (Equity Indices & Cornmodlites, G20 Gov. Credit) 2/13/2014 2,500,000 2,000,000 1,500,000 1,000,000 500,000 <.1. N'.3• .0. N'3' N2.
2 mentions1 same-page
Page ?Same page
11,251 114.69 127.38 13.83 0.80% SIE GR Equity 946 8,907 114.81 127.00 12.55 0.85% SLB US Equity 728 6,378 79.97 89.09 14.00 0.82% SMSN LI Equity 541 (7,188) 644.51 596.02 7.80 0.96% SO US Equity 13S (8,909) 41.73 41.10 3.30 0.46% SPG US Equity (73) (4,664) 154.12 156.55 -2.2
Historical Net Exposure by Geography (Usted Equities) & Macro (Equity indkes & Commodlites, G20 Gov. Credit) Historical Gross Exposure by Geography (Usted Equities) & Maao (Equity Indices & Cornmodlites, G20 Gov. Credit) 2/7/2014 EFTA_R1_02065390 EFTA02700206 Atorus, LLC Current Gross Notional Risk by Cate
2 mentions1 same-page
Page ?Same page
11,251 114.76 127.61 13.96 0.80% SIC GR Equity 993 8,907 79.97 88.89 13.51 0.82% SLB US Equity 728 6,378 535.09 596.15 13.67 0.83% SMSN LI Equity 541 (7,188) 44.59 41.23 7.63 0.99% SO US Equity 135 (8,909) 160.36 157.93 3.20 0.47% SPG US Equity (92) (3,731) 88.42 90.61 -3.31
Historical Net Exposure by Geography (Usted Equities) & Macro (Equity indkes & Commodlites, G20 Gov. Credit) Historical Gross Exposure by Geography (Usted Equities) & Maao (Equity Indices & Cornmodikes, G20 Gov. Credit) 2/10/2014 EFTA_R1_02065374 EFTA02700190 Atorus, LLC 2/10/2014 Current Gross Notional R
Sponsored
2 mentions1 same-page
Page ?Same page
,251 114.69 128.55 15.07 0.80% SIE GR Equity 1,078 8,901 114.81 128.71 15.20 0.80% SLB US Equity 848 6,526 79.94 90.32 15.66 0.83% SMSN LI Equity 309 (7,254) 644.51 617.04 4.26 1.00% SO US Equity 24 (9,006) 41.73 41.62 0.54 0.49% SPG US Equity (153) (3,764) 151.46 157.61 -5.4
O O. % ...t. ,%41, 4,b .4)) .;,,, • 4, st, ,,Q9 tQt. 'b 4) 1 it> ON, '8 &Is Q. Q. Q. 4 b 4 b .., Historical Gross Exposure by Geography (Usted Equities) & Maao (Equity Indices & Cornmodlites, G20 Gov. Credit) 2/12/2014 2,500,000 2,000,000 1,500,000 1,000,000 500,000 '0' '0' ,og N, .b ,s%
2 mentions1 same-page
Page ?Same page
50 0.78% 193.00 SIE GR Equity 1,416 8,908 114.81 133.06 20.21 0.79% 148.43 SLB US Equity 1,090 6,528 79.94 93.29 19.36 0.86% 93.79 SMSN LI Equity 216 (7.260) 644.51 625.31 3.15 0.95% (11.22) SO US Equity 42.30 0.44% - SPG US Equity 29 4,487 160.18 161.20 0.87 0.73% 28.22 SRE
' O.‘ 31 ‘ 12 O 1. 41 A1. .Q. ••k "b\ 4 ' \' • 0% 1. \ 0, O%% O% 91. 41 (1000.0001 (3000,0001 Historical Gross Exposure by Geography (Usted Equities) & Maao (Equity Indices & Cornmodlites, G20 Gov. Credit) 2,500,000 2,000,000 1,500000 1,000,000 500.000 , 9 „ ,19•G 49 (5,0' (9 ,;;;‘,'› (
2 mentions1 same-page
Page ?Same page
.85% (435.43) SIE GR Equity 1,083 8,908 114.81 128.77 13.76 0.88% (322.03) SLB US Equity 930 6,528 79.94 91.33 15.34 0.93% (156.90) SMSN LI Equity 317 (7,260) 644.51 616.36 4,60 0.95% 108.41 SO US Equity 925 42.17 42.17 0.00 0.48% (2.85) SPG US Equity 32 4,487 160.18 161.34 0
Historical Net Exposure by Geography (Usted Equities) & Macro (Equity indkes & Commodlites, G20 Gov. Credit) Historical Gross Exposure by Geography (Usted Equities) & Maao (Equity Indices & Cornmodlites, G20 Gov. Credit) 3/3/2014 2,500,000 2,000,000 1,500,000 1,000,000 500.000 e9 % % tV tar %Q. (6)
Sponsored
2 mentions1 same-page
Page ?Same page
13.36 1.01% 188.44 SIE GR Equity 711 5,345 114.81 130.09 13.49 0.99% 251.01 SLB US Equity 785 6,528 79.94 89.56 15.13 0.79% 8.41 SMSN LI Equity 537 (7,260) 644.51 596.83 7.52 0.98% (41.25) SO US Equity - 43.52 0.53% SPG US Equity 70 4,487 160.18 162.67 2.41 0.65% 33.95 SRE
Historical Net Exposure by Geography (Usted Equities) & Macro (Equity indkes & Commodlites, G20 Gov. Credit) Historical Gross Exposure by Geography (Usted Equities) & Maao (Equity Indices & Cornmodlites, G20 Gov. Credit) 3/17/2014 2,500,000 1.500.030 1,000,000 S03,000 eQ. et Q. Q9 Q9 419 •f.) ..tssv
2 mentions1 same-page
Page ?Same page
15.30 1.10% 27.34 SIE GR Equity 995 5,345 114.81 136.18 18.03 1.03% 42.13 SLB US Equity 1,501 7,174 81.27 98.28 26.83 0.78% 31.54 SMSN LI Equity (110) (7,500) 642.17 651.61 -1.42 1.04% (155.67) SO US Equity 37 5,537 43.08 43.36 1.23 0.54% 3.54 SPG US Equity 19 4,673 163.56
Historical Net Exposure by Geography (Usted Equities) & Macro (Equity indkes & Commodlites, G20 Gov. Credit) Historical Gross Exposure by Geography (Usted Equities) & Maao (Equity Indices & Commodlites, G20 Gov. Credit) 4/3/2014 EFTA_R1_02139128 EFTA02714157 Atorus, LLC 4/3/2014 Current Gross Notional Ris
Sponsored
Mutual Connections (36)
Entities connected to both SMSN LI Equity and Usted Equities
Ghislaine Maxwell
PERSON51 w/ SMSN·14 w/ Usted
AT
Atorus
PERSON45 w/ SMSN·14 w/ Usted
ENI IM Equity
ORGANIZATION38 w/ SMSN·10 w/ Usted
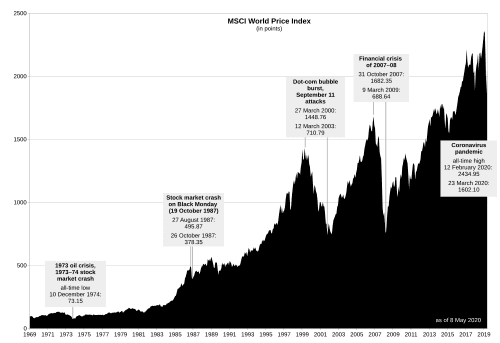
MSCI World
ORGANIZATION34 w/ SMSN·13 w/ Usted
Current Portfolio -Listed Equity Portfolio
ORGANIZATION29 w/ SMSN·9 w/ Usted
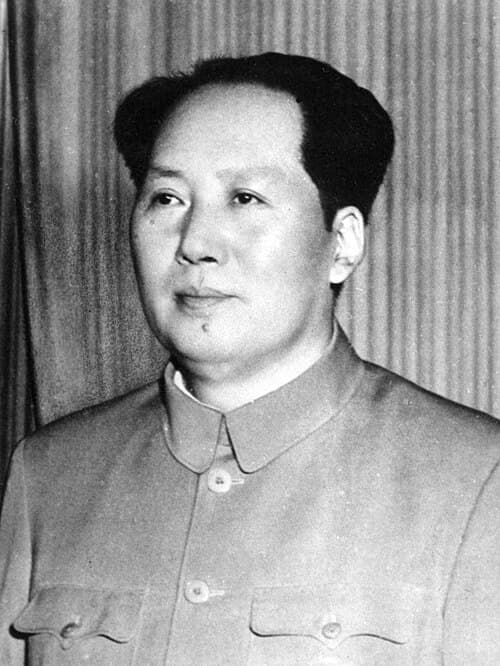
Mao Zedong
PERSON15 w/ SMSN·14 w/ Usted
Largest MTM
ORGANIZATION22 w/ SMSN·2 w/ Usted
Usted Equities) & Macro
ORGANIZATION9 w/ SMSN·14 w/ Usted
EquityCom
ORGANIZATION16 w/ SMSN·3 w/ Usted
GE US Equity
ORGANIZATION13 w/ SMSN·5 w/ Usted
SU CN Equity
ORGANIZATION7 w/ SMSN·10 w/ Usted
Equity Indices & Commodlites
ORGANIZATION10 w/ SMSN·4 w/ Usted
MCD US Equity
ORGANIZATION6 w/ SMSN·5 w/ Usted
ITUB4 8Z
ORGANIZATION4 w/ SMSN·7 w/ Usted
STEICNZL
ORGANIZATION6 w/ SMSN·3 w/ Usted
WIP US Equity
ORGANIZATION3 w/ SMSN·6 w/ Usted
ITUB4 8Z Equity
ORGANIZATION4 w/ SMSN·5 w/ Usted
NSC US Equity
ORGANIZATION4 w/ SMSN·4 w/ Usted
MTM Gains(Losse
ORGANIZATION5 w/ SMSN·3 w/ Usted
K GR Equity
ORGANIZATION3 w/ SMSN·5 w/ Usted