Back to Network
6
Shared Docs
6
Same-Page
6 / 6
Mentions
Document Mentions (6 shared documents)
2 mentions1 same-page
Page ?Same page
50 0.78% 193.00 SIE GR Equity 1,416 8,908 114.81 133.06 20.21 0.79% 148.43 SLB US Equity 1,090 6,528 79.94 93.29 19.36 0.86% 93.79 SMSN LI Equity 216 (7.260) 644.51 625.31 3.15 0.95% (11.22) SO US Equity 42.30 0.44% - SPG US Equity 29 4,487 160.18 161.20 0.87 0.73% 28.22 SRE
.92% EFTA_R1_02108309 EFTA02708065 SXTP Index 24,222 1.30% SXDP Index 26,317 1.41% ISEQ Index 27,653 1.48% IE_TSY CREDIT 30,271 1.62% STEICNZL Index 32,687 1.75% GILD US Equity 34,155 1.83% No. Names by Cat APAC Long 29 APAC Short 23 EMEA long 81 EMEA Short 11 AMER Long 172
2 mentions1 same-page
Page ?Same page
.85% (435.43) SIE GR Equity 1,083 8,908 114.81 128.77 13.76 0.88% (322.03) SLB US Equity 930 6,528 79.94 91.33 15.34 0.93% (156.90) SMSN LI Equity 317 (7,260) 644.51 616.36 4,60 0.95% 108.41 SO US Equity 925 42.17 42.17 0.00 0.48% (2.85) SPG US Equity 32 4,487 160.18 161.34 0
.93% EFTA_R1_02108293 EFTA02708049 SXTP Index 22,537 1.26% SXDP Index 23,874 1.33% ISEQ Index 25,661 1.43% IE_TSY CREDIT 30,087 1.68% STEICNZL Index 32,687 1.82% GILD US Equity 33,260 1.85% No. Names by Cat APAC Long 29 APAC Short 23 EMEA Long 79 EMEA Short 11 AMER Long 169
2 mentions1 same-page
Page ?Same page
15.30 1.10% 27.34 SIE GR Equity 995 5,345 114.81 136.18 18.03 1.03% 42.13 SLB US Equity 1,501 7,174 81.27 98.28 26.83 0.78% 31.54 SMSN LI Equity (110) (7,500) 642.17 651.61 -1.42 1.04% (155.67) SO US Equity 37 5,537 43.08 43.36 1.23 0.54% 3.54 SPG US Equity 19 4,673 163.56
.00% EFTA_R1_02139126 EFTA02714155 SXTP Index 22,620 1.22% SXDP Index 23,480 1.27% ISEQ Index 25,523 1.38% IE_TSY CREDIT 30,517 1.65% STEICNZL Index 35,430 1.91% No. Names by Cat APAC Long 23 APAC Short 24 EMEA long 74 EMEA Short 13 AMER Long 170 AMER Short 39 EquityCom Long
Sponsored
2 mentions1 same-page
Page ?Same page
5.78 0.92% 32.63 SIE GR Equity 1,258 8,908 114.81 131.03 15.77 0.90% 63.97 SLB US Equity 991 6,528 79.94 92.07 17.12 0.89% (31.13) SMSN LI Equity 279 (7,260) 644.51 619.70 4.07 0.94% (36.70) SO US Equity (3) (1,838) 42.25 42.31 -0.30 0.46% 1.02 SPG US Equity 92 4,487 160.18
,517 0.83% SPX Index 17,886 0.95% SXTP Index 23,795 1.27% SXDP Index 25,530 1.36% ISEQ Index 26,136 1.39% IE_TSY CREDIT 30,134 1.61% STEICNZL Index 32,687 1.74% GILD US Equity 34,069 1.81% J APAC Lon 29 APAC Short 23 EMEA Long 78 EMEA Short 12 AMER Long 168 AMER Short 47 E
2 mentions1 same-page
Page ?Same page
1.01% (193.31) SIE GR Equity 938 8,908 114.81 126.90 11.10 0.95% (149.30) SLB US Equity 903 6,528 79.94 90.99 16.21 0.85% (120.29) SMSN LI Equity 454 (7,260) 644.51 604.20 6.51 0.96% 178.78 SO US Equity (20) (3,667) 42.15 42.38 -1.10 0.49% (29.41) SPG US Equity 55 4,487 160.1
dex 23,136 1.25% EFTA00293118 SXDP Index 23,848 1.29% ISEQ Index 25,563 1.38% IE_TSY CREDIT 31,595 1.71% GILD US Equity 32,057 1.74% STEICNZL Index 32,687 1.77% APAC Lon 30 APAC Short 21 EMEA Long 76 EMEA Short 14 AMER Long 169 AMER Short 45 E • uityCom Lon 65 EquityCom Sho
2 mentions1 same-page
Page ?Same page
.85% (435.43) SIE GR Equity 1,083 8,908 114.81 128.77 13.76 0.88% (322.03) SLB US Equity 930 6,528 79.94 91.33 15.34 0.93% (156.90) SMSN LI Equity 317 (7,260) 644.51 616.36 4.60 0.95% 108.41 SO US Equity 925 42.17 42.17 0.00 0.48% (2.85) SPG US Equity 32 4,487 160.18 161.34 0
X Index 16,685 0.93% EFTA00293459 SXTP Index 22,537 1.26% SXDP Index 23,874 1.33% ISEQ Index 25,661 1.43% IE_TSY CREDIT 30,087 1.68% STEICNZL Index 32,687 1.82% GILD US Equity 33,260 1.85% APAC Lon 29 APAC Short 23 EMEA Long 79 EMEA Short 11 AMER Long 169 AMER Short 44 E •
Sponsored
Mutual Connections (32)
Entities connected to both SMSN LI Equity and STEICNZL
Ghislaine Maxwell
PERSON51 w/ SMSN·10 w/ STEICNZL
AT
Atorus
PERSON45 w/ SMSN·9 w/ STEICNZL
ENI IM Equity
ORGANIZATION38 w/ SMSN·7 w/ STEICNZL
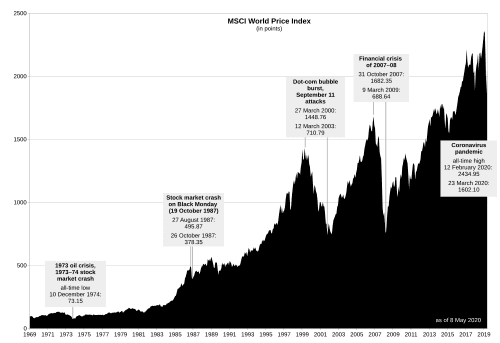
MSCI World
ORGANIZATION34 w/ SMSN·6 w/ STEICNZL
Current Portfolio -Listed Equity Portfolio
ORGANIZATION29 w/ SMSN·5 w/ STEICNZL
AU TSY
ORGANIZATION25 w/ SMSN·3 w/ STEICNZL
MSCI World Change
ORGANIZATION19 w/ SMSN·7 w/ STEICNZL
EquityCom
ORGANIZATION16 w/ SMSN·3 w/ STEICNZL
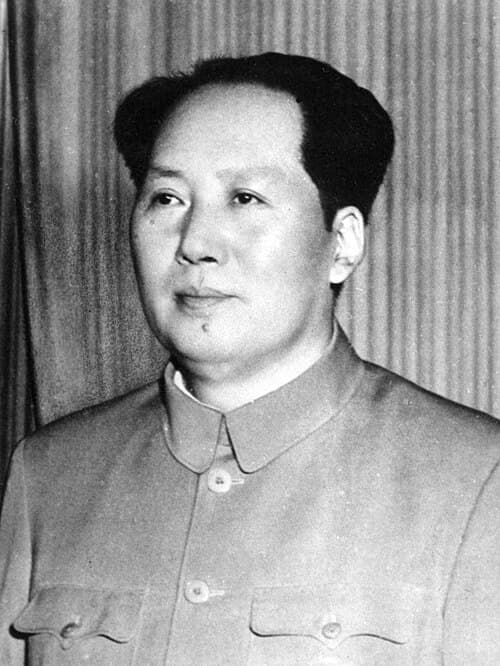
Mao Zedong
PERSON15 w/ SMSN·3 w/ STEICNZL
GE US Equity
ORGANIZATION13 w/ SMSN·3 w/ STEICNZL
BIIB US Equity
ORGANIZATION9 w/ SMSN·5 w/ STEICNZL
Usted Equities) & Macro
ORGANIZATION9 w/ SMSN·3 w/ STEICNZL
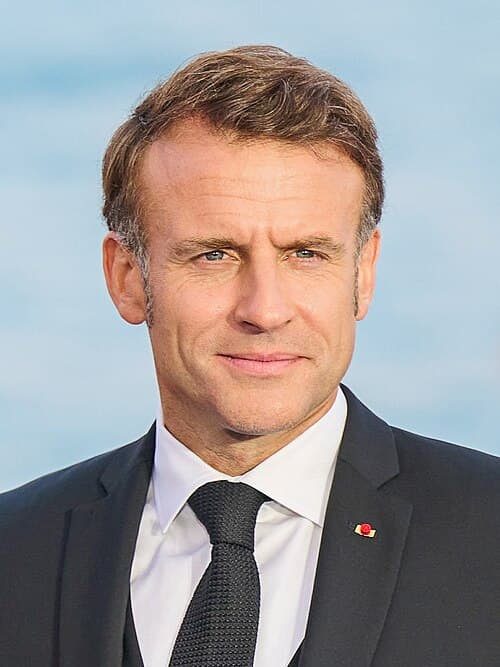
Emmanuel Macron
PERSON9 w/ SMSN·2 w/ STEICNZL
Usted Equities
ORGANIZATION8 w/ SMSN·3 w/ STEICNZL
MOLZ US Equity
ORGANIZATION5 w/ SMSN·5 w/ STEICNZL
SU CN Equity
ORGANIZATION7 w/ SMSN·3 w/ STEICNZL
MCD US Equity
ORGANIZATION6 w/ SMSN·4 w/ STEICNZL
SWEOA
ORGANIZATION5 w/ SMSN·3 w/ STEICNZL
MCK US Equity
ORGANIZATION6 w/ SMSN·2 w/ STEICNZL
BIL S.I Equity
ORGANIZATION5 w/ SMSN·3 w/ STEICNZL