Back to Network
5
Shared Docs
5
Same-Page
5 / 5
Mentions
Document Mentions (5 shared documents)
2 mentions1 same-page
Page ?Same page
Exposure by Geography (Listed Equities) & Macro (Equity Indices & Comrnodlltes, G20 Gov. Credit) —APAC — EMEA —AMER — EquityCom —G20 Rates , ,NexEposule RIG 2.000,000 1.500,000 5,000.000 4,0003)00 3,000.000 2,000.000 1,000,000 0 M i n e ) (2,000,003) 1000000 Nr O O G 4 1 . G ' I
(240.38) XLK US Equity 2,334 12,860 30.80 36.39 23.36 0.78% (41.64) XLI US Equity 6,179 16,147 38.20 52.82 57.50 0.67% (33.76) XLP US Equky 610 11,341 41.94 44.20 15.02 0.36% XLY US Equity 1,251 5,441 52.24 64.25 27.10 0.85% 16.71 XLE US Equity 745 9,734 87.06 93.72 12
2 mentions1 same-page
Page ?Same page
t Exposure by Geography (Listed Equities) & Macro (Equity Indices & Commodites, G20 Gov. Credit) —APAC — Emu —AMER — EquityCom —G20 Rates . • NexEposule RIG 2,500,000 7,000,000 6,000,000 2,003000 5,000,000 1,503000 0,000,000 3,000,000 1,000,000 ( 2,000,000 500,000 Nt III 1,000,000 0 el
.71% (40.25) XLK US Equity 3,461 13,272 30.99 39.07 51.92 0.50% 119.06 XLI US Equity 4,653 12,917 38.20 51.96 67.22 0.54% 61.08 XLP US Equky 405 13,034 42.30 43.61 7.19 0.43% 43.28 XLY US Equity 1,427 12,582 59.54 66.29 20.18 0.56% 136.57 XLE US Equity 1,219 14,589 89.95
2 mentions1 same-page
Page ?Same page
,000 3,000,000 21200,000 1,000.000 0 (1.000,003) (2.000,003) 1.000,000 500,000 1 Skr (5063) 4 APAC EMEA 'A—AMER — EquityCom —G20 Rates NexEposule RIG C $ % 4% S 4 A\ y\ 44) \ % 4) 4 4 ) •1.') cirs. '' o •O' % N. N.. ' Or % O cif 4"" (1,000,000) (3,000,000) Istorical Gross E
38.65 41.01 11.94 0.51% XLK US Equity 2,200 12,860 30.80 36.07 32.75 0.52% XLI US Equity 5,719 16,147 38.20 51.73 60.28 0.59% XLP US Equky 246 9,167 41.63 42.75 7.14 0.38% XLY US Equity 7,721 20,539 46.72 64.28 67.51 0.56% XLE US Equity 316 7,366 85.40 89.06 6.97 0.62
Sponsored
2 mentions1 same-page
Page ?Same page
t Exposure by Geography (Listed Equities) & Macro (Equity Indices & Commodites, G20 Gov. Credit) —APAC — EMEA —AMER — EquityCom —G20 Rates , ,NexEposule RIG 2.003,000 1,500000 5,000.030 4,000.000 3000.000 2000.000 1,000.000 (1.000.0(M) (2,004003) 3,000,000 (060 4t .4i9GtSIS9N 'O. 411. ad1,
(36.82) XLK US Equity 2,196 12,860 30.80 36.06 31.94 0.53% (181.50) XLI US Equity 5,588 16,147 38.20 51.42 59.66 0.58% (221.74) XLP US Equky 229 9,167 41.63 42.67 6.29 0.40% (21.97) XLY US Equity 7,646 20,539 46.72 64.11 70.37 0.53% (226.77) XLE US Equity 160 7,366 85.40
2 mentions1 same-page
Page ?Same page
Exposure by Geography (Listed Equities) & Macro (Equity Indices & Comrnodlltes, G20 Gov. Credit) —APAC — EMEA —AMER — EquityCom —G20 Rates , ,NexEposule RIG 2.000,000 1.500,000 5,000.000 4,0003)00 3,000.000 2,000.000 1,000,000 0 M i n e ) (2,000,003) 1000000 Nr O O G 4 1 . G ' I
(240.38) XLK US Equity 2,334 12,860 30.80 36.39 23.36 0.78% (41.64) XLI US Equity 6,179 16,147 38.20 52.82 57.50 0.67% (33.76) XLP US Equky 610 11,341 41.94 44.20 15.02 0.36% XLY US Equity 1,251 5,441 52.24 64.25 27.10 0.85% 16.71 XLE US Equity 745 9,734 87.06 93.72 12
Sponsored
Mutual Connections (21)
Entities connected to both NexEposule and US Equky
AT
Atorus
PERSON10 w/ NexEposule·14 w/ US
Ghislaine Maxwell
PERSON10 w/ NexEposule·14 w/ US
EquityCom
ORGANIZATION10 w/ NexEposule·12 w/ US
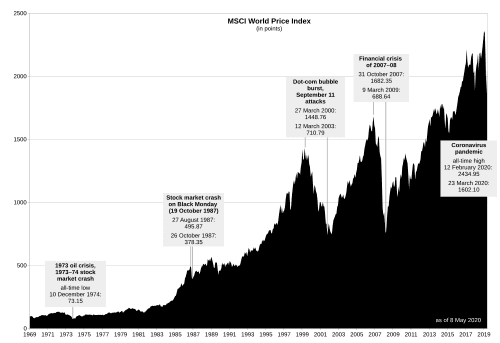
MSCI World Change
ORGANIZATION9 w/ NexEposule·11 w/ US
AU TSY
ORGANIZATION9 w/ NexEposule·11 w/ US
MSCI World
ORGANIZATION8 w/ NexEposule·10 w/ US
Current Portfolio -Listed Equity Portfolio
ORGANIZATION8 w/ NexEposule·8 w/ US
ENI IM Equity
ORGANIZATION5 w/ NexEposule·10 w/ US
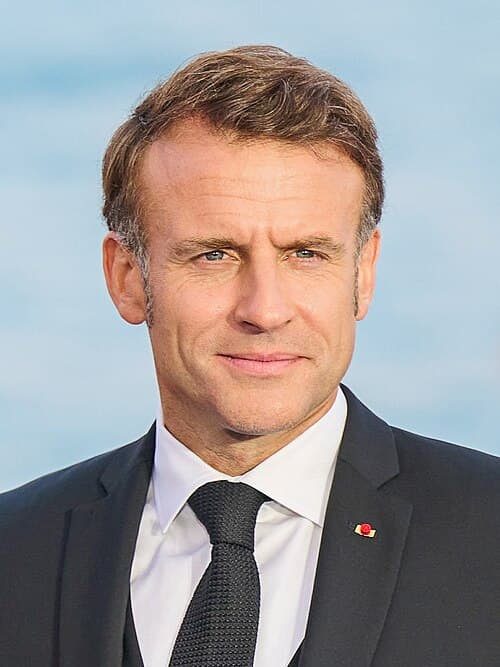
Emmanuel Macron
PERSON6 w/ NexEposule·9 w/ US
BMW GR
ORGANIZATION4 w/ NexEposule·6 w/ US
PSI2O
ORGANIZATION4 w/ NexEposule·3 w/ US
Largest Exposures Current
ORGANIZATION3 w/ NexEposule·4 w/ US
SAS LN Equity
ORGANIZATION2 w/ NexEposule·4 w/ US
Sharpe
ORGANIZATION2 w/ NexEposule·4 w/ US
MCD US Equity
ORGANIZATION2 w/ NexEposule·3 w/ US
Fl TSY
ORGANIZATION2 w/ NexEposule·3 w/ US
Position (ex-99pct & ex-lst
ORGANIZATION2 w/ NexEposule·2 w/ US
ASS1
ORGANIZATION2 w/ NexEposule·2 w/ US
CO
Comdty
PERSON2 w/ NexEposule·2 w/ US
TYC US Equity
ORGANIZATION2 w/ NexEposule·2 w/ US