Back to Network

4
Shared Docs
4
Same-Page
4 / 4
Mentions
Document Mentions (4 shared documents)
2 mentions1 same-page
Page ?Same page
ort -0.149% G20 Rates Long 0.135% G20 Rates Short -0.024% T12M Contribution (% of total Yr/Yr NAV Change by Category) Listed Equities 38.75% EquityCom 50.98% G20 Rates 12.07% % of Total Notional Security MTM Gain % Total NAV 28.21%l 42 Positions 20.47% 0.59% NEE US Equity 5,220 0.25%
0.52% (286.02) CM AU Equity 1,832 18,106 70.10 77.19 20.57 0.49% 241.28 CBS US Equity (193) 7,287 60.70 59.13 -2.23 1.19% (63.74) CCL US Equity 36.48 CELG US Equity (1) (534) 88.66 88.83 -0.07 2.71% (13.35) CFR VX Equity 104 10,967 99.46 100.40 1.90 0.50% 44.83 CL US Equity
2 mentions1 same-page
Page ?Same page
uityCom Short .0.024% G20 Rates Long 0.171% G20 Rates Short .0.009% T12M Contribution to Yr/Yr NAV Change by Category Listed Equities 43.56% EquityCom 48.15% G20 Rates 8.99% % of Total Notional Security MTM Gain % Total NAV 20.97%1 45 Positions 25.62% 0.11% MDY US Equity 5,234 0.28% 0
.73 0.65% (11.75) CBA AU Equity 1,572 17,559 69.92 76.18 17.22 0.52% 143.61 CBS US Equity (5) 1,652 60.25 60.09 -0.27 1.04% (9.17) CCL US Equity 594 6,257 36.20 39.64 11.08 0.86% 34.93 CELG US Equity 96 3,789 149.03 152.80 2.26 1.12% (52.60) CFR VX Equity 573 9,275 KN/A N/A
2 mentions1 same-page
Page ?Same page
ort -0.149% G20 Rates Long 0.135% G20 Rates Short -0.024% T12M Contribution (% of total Yr/Yr NAV Change by Category) Listed Equities 38.75% EquityCom 50.98% G20 Rates 12.07% % of Total Notional Security MTM Gain % Total NAV 28.21%l 42 Positions 20.47% 0.59% NEE US Equity 5,220 0.25%
0.52% (286.02) CM AU Equity 1,832 18,106 70.10 77.19 20.57 0.49% 241.28 CBS US Equity (193) 7,287 60.70 59.13 -2.23 1.19% (63.74) CCL US Equity 36.48 CELG US Equity (1) (534) 88.66 88.83 -0.07 2.71% (13.35) CFR VX Equity 104 10,967 99.46 100.40 1.90 0.50% 44.83 CL US Equity
Sponsored
2 mentions1 same-page
Page ?Same page
Short 0.197% G20 Rates Long -0.119% G20 Rates Short 0.006% T12M Contribution (% of total Yr/Yr NAV Change by Category) Listed Eqwbe% 40.11% EquityCom 47.79% G20 Rates 13.68% % of Total Notional Security MTM Gain % Total NAV 23.99%1 43 Positions 21.45% 0.11% AZN SS Equity 5,580 0.28%
0.74% (157.46) CBA AU Equity 1,476 17,832 70.01 75.81 14.95 0.55% (33.94) CBS US Equity 124 7,287 60.74 61.77 1.71 0.99% (187.14) CCL US Equity (1) 2,706 36.49 36.48 -0.04 0.76% (29.68) CELG US Equity 5 (534) 88.66 87.75 1.07 0.96% (7.27) CFR VX Equity 143 10,967 99.46 100
Sponsored
Mutual Connections (21)
Entities connected to both EquityCom and CCL US Equity
Ghislaine Maxwell
PERSON57 w/ EquityCom·5 w/ CCL
AT
Atorus
PERSON54 w/ EquityCom·5 w/ CCL
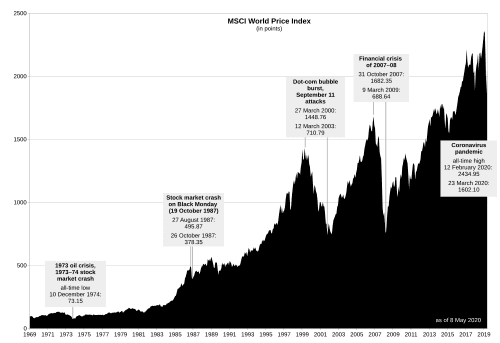
MSCI World
ORGANIZATION48 w/ EquityCom·5 w/ CCL
Current Portfolio -Listed Equity Portfolio
ORGANIZATION41 w/ EquityCom·3 w/ CCL
AU TSY
ORGANIZATION40 w/ EquityCom·3 w/ CCL
Emmanuel Macron
PERSON29 w/ EquityCom·4 w/ CCL
MSCI World Change
ORGANIZATION31 w/ EquityCom·2 w/ CCL
ENI IM Equity
ORGANIZATION31 w/ EquityCom·2 w/ CCL
Sharpe
ORGANIZATION20 w/ EquityCom·4 w/ CCL
BMW GR
ORGANIZATION16 w/ EquityCom·4 w/ CCL
Largest Exposures Current
ORGANIZATION15 w/ EquityCom·3 w/ CCL
CBS US Equity
ORGANIZATION9 w/ EquityCom·2 w/ CCL
MCK US Equity
ORGANIZATION7 w/ EquityCom·3 w/ CCL
CO
Comdty
PERSON8 w/ EquityCom·2 w/ CCL
Equities) & Macro
ORGANIZATION7 w/ EquityCom·2 w/ CCL
Position (ex-99pct & ex4st
ORGANIZATION4 w/ EquityCom·2 w/ CCL
Percentile Distribution of Current MTM
ORGANIZATION3 w/ EquityCom·2 w/ CCL
AGN US Equity
ORGANIZATION3 w/ EquityCom·2 w/ CCL
UCG IM Equity
ORGANIZATION3 w/ EquityCom·2 w/ CCL
NexEposum
ORGANIZATION2 w/ EquityCom·2 w/ CCL