Back to Network
6
Shared Docs
6
Same-Page
6 / 6
Mentions
Document Mentions (6 shared documents)
2 mentions1 same-page
Page ?Same page
5/1/2014 Historical Net Exposure by Geography (Listed Equities) & Macro (Equity Indices & Comrnodlltes, G20 Gov. Credit) —APAC — EMEA —AMER — EquityCom —G20 Rates , ,NexEposule RIG 2.000,000 1.500,000 5,000.000 4,0003)00 3,000.000 2,000.000 1,000,000 0 M i n e ) (2,000,003) 1000000 Nr
4,521.85 35.51 0.71% SMI Index 7,455 46,103 8,271.65 9,609.28 33.96 0.48% FTSEMIB Index 7,737 25,266 23,118.94 30,198.56 32.38 0.95% PSI2O Index 7,305 24,289 8,026.78 10,440.77 35.90 0.84% ISEQ Index 24,411 40,099 4,246.25 6,831.25 74.77 0.81% ICEXI Index 4,952 37,337 6.
2 mentions1 same-page
Page ?Same page
graphy (Listed Equities) & Macro (Equity Indices & Commodites, G20 Gov. Credit) 6.000.030 3,000.000 4,000.000 3,000.000 ,_, ApAc EMEA —AMER — EquityCom —G20 Rates NexEposure REIS 3,000,000 1,SOD,000 1,000,000 500.000 . , (se% — 3,030.000 1,000.000 , ON' O. %•• oN, fo cl• AL v. Np.
.54) SMI Index 7,826 49,310 8,386.17 9,717.20 40.42 0.39% 264.19 FTSEMIB Index 5,490 25,266 22,844.83 27,808.71 19.22 1.13% (364.66) PSI2O Index 4,041 24,476 8,057.64 9,388.03 16.05 1.03% 57.83 ISEQ Index 17,634 32,079 4,265.78 6,610.67 58.80 0.93% 228.75 ICEXI Index 2,2
2 mentions1 same-page
Page ?Same page
ort -0.013% G20 Rates Long -0.174% G20 Rates Short 0.010% T12M Contribution (% of total Yr/Yr NAV Change by Category) Listed Equities 45.98% EquityCom 46.43% G20 Rates 7.70% % cd Total Notional Security MTM Gain % Total NAV 20.72%1 45 Positions 25.69% 0.11% AGN US Equity 5,298 0.28% 0
0.12) SMI Index 7,773 51,684 8,403.69 9,667.60 48.06 0.31% 15.12 FTSEMIB Index 7,118 25,266 23,035.16 29,524.51 25.66 1.10% (117.36) PSI2O Index 5,155 24,476 8,025.00 9,715.08 22.87 0.92% (60.17) ISEQ Index 18,404 32,079 4,240.92 6,674.03 69.76 0.82% ICEXI Index 1,037 14
Sponsored
2 mentions1 same-page
Page ?Same page
ort -0.001% G20 Rates Long 0.068% G20 Rates Short 0.061% 112r4 Contribution (% of total Yr/Yr NAV Change by Category) Listed Equities 28.92% EquityCom 60.81% G20 Rates 12.93% % of Total Notional Security MTM Gain % Total NAV 29.26%l 40 Positions 18.61% 0.88% DTV US Equity 4,086 0.21%
27.14 0.73% (84.80) SMI Index 911 10,740 8,442.28 9,158.53 16.70 0.51% FTSEMIB Index 24 1,404 26,886.83 27,345.71 1.60 1.06% (0.16) PSI2O Index 11,599 (94,327) 8,956.04 7,854.79 8.55 1.44% It (924.24 ISEQ Index 2,138 (59,652) 6,404.62 6,175.04 5.82 0.62% 230.94 ICEXI Ind
2 mentions1 same-page
Page ?Same page
3/27/2014 Historical Net Exposure by Geography (Listed Equities) & Macro (Equity Indices & Commodites, G20 Gov. Credit) —APAC — EMEA —AMER — EquityCom —G20 Rates , ,NexEposule RIG 2.000,000 1,503,000 5,000.030 4,000.000 1000.000 2,000.000 1,000,000 0 (5.000.000) 41. (2,000,003) 3000000
5.19 SMI Index 6,298 44,078 8,219.62 9,394.17 22.72 0.63% (146.63) FTSEMIB Index 6,543 25,266 23,118.99 29,105.64 28.31 0.91% (0.42) PSI2O Index 6,971 24,289 8,026.78 10,330.55 25.87 1.11% (61.82) ISEQ Index 24,394 40,099 4,246.25 6,829.49 60.38 1.01% (409.55) ICEXI Index
2 mentions1 same-page
Page ?Same page
5/1/2014 Historical Net Exposure by Geography (Listed Equities) & Macro (Equity Indices & Comrnodlltes, G20 Gov. Credit) —APAC — EMEA —AMER — EquityCom —G20 Rates , ,NexEposule RIG 2.000,000 1.500,000 5,000.000 4,0003)00 3,000.000 2,000.000 1,000,000 0 M i n e ) (2,000,003) 1000000 Nr
4,521.85 35.51 0.71% SMI Index 7,455 46,103 8,271.65 9,609.28 33.96 0.48% FTSEMIB Index 7,737 25,266 23,118.94 30,198.56 32.38 0.95% PSI2O Index 7,305 24,289 8,026.78 10,440.77 35.90 0.84% ISEQ Index 24,411 40,099 4,246.25 6,831.25 74.77 0.81% ICEXI Index 4,952 37,337 6.
Sponsored
Mutual Connections (18)
Entities connected to both EquityCom and PSI2O
Ghislaine Maxwell
PERSON57 w/ EquityCom·6 w/ PSI2O
AT
Atorus
PERSON54 w/ EquityCom·6 w/ PSI2O
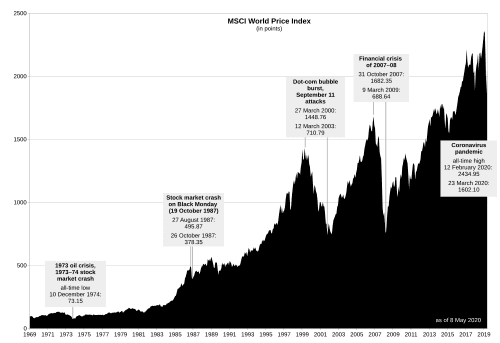
MSCI World
ORGANIZATION48 w/ EquityCom·6 w/ PSI2O
Current Portfolio -Listed Equity Portfolio
ORGANIZATION41 w/ EquityCom·6 w/ PSI2O
AU TSY
ORGANIZATION40 w/ EquityCom·6 w/ PSI2O
MSCI World Change
ORGANIZATION31 w/ EquityCom·5 w/ PSI2O
ENI IM Equity
ORGANIZATION31 w/ EquityCom·4 w/ PSI2O
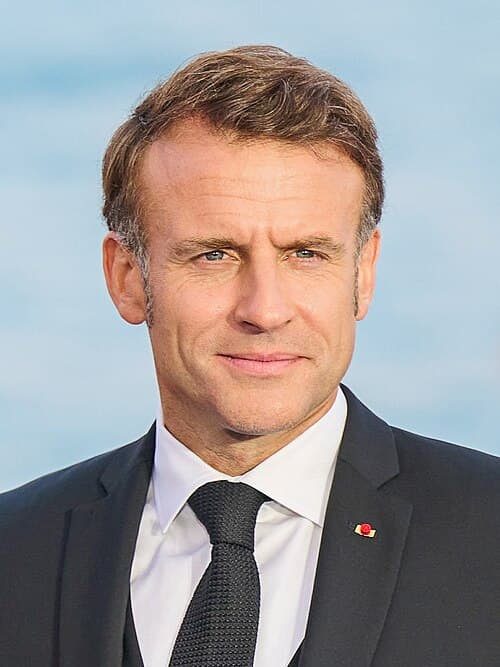
Emmanuel Macron
PERSON29 w/ EquityCom·3 w/ PSI2O
Sharpe
ORGANIZATION20 w/ EquityCom·2 w/ PSI2O
BMW GR
ORGANIZATION16 w/ EquityCom·2 w/ PSI2O
Largest Exposures Current
ORGANIZATION15 w/ EquityCom·2 w/ PSI2O
SAS LN Equity
ORGANIZATION13 w/ EquityCom·2 w/ PSI2O
US Equky
ORGANIZATION12 w/ EquityCom·3 w/ PSI2O
NexEposule
ORGANIZATION10 w/ EquityCom·4 w/ PSI2O
CO
Comdty
PERSON8 w/ EquityCom·2 w/ PSI2O
ASS1
ORGANIZATION4 w/ EquityCom·2 w/ PSI2O
Fl TSY
ORGANIZATION3 w/ EquityCom·2 w/ PSI2O
Equity Indices & Comrnodlltes
ORGANIZATION2 w/ EquityCom·2 w/ PSI2O