Back to Network

3
Shared Docs
3
Same-Page
7 / 3
Mentions
Document Mentions (3 shared documents)
5 mentions1 same-page
Page ?Same page
eas Deutsche Bank equity research analysts sometimes have shorter-term trade ideas (known as SOLAR ideas) that are consistent or inconsistent with Deutsche Bank's existing longer term ratings. These trade ideas can be found at the SOLAR link at http://gm.db.com. 3. Country-Specific Disclosures Australia and
l Head of Research Marcel Cassard Global Head CB&S Research Asia-Pacific Fergus Lynch Regional Head International locations Deutsche Bank AG Deutsche Bank Place Level 16 Corner of Hunter & Phillip Streets Sydney, NSW 2000 Australia Tel: (61) 2 8258 1234 Deutsche Bank AG London 1 Great Winchester Street
rector Equity Research North America Steve Pollard Regional Head Global Disclaimer The information and opinions in this report were prepared by Deutsche Bank AG or one of its affiliates (collectively "Deutsche Bank"). The information herein is believed to be reliable and has been obtained from public source
t in deciding to trade on a EFTA01464586 proprietary basis. Unless governing law provides otherwise, all transactions should be executed through the Deutsche Bank entity in the investor's home jurisdiction. In the U.S. this report is approved and/or distributed by Deutsche Bank Securities Inc., a member of th
is still 200bps higher than its average of 390bps. 10 15 20 25 30 35 0 5 LTM PE (lhs) Source: S&P, FRB, Deutsche Bank Implied ERP (rhs) Avg PE = 15.9 Overstated EPS from inflation distortions 0% 2% 4% 6% 8% 10% 12% A -15 forward PE wouldn't be threatened until 10yr yields are wel
3 mentions1 same-page
Page ?Same page
3.6 -3.3 -2.5 -3.4 -9.7 -7.6 -3.2 62.0 120.0 175.0 250.0 4.6 -0.3 -0.9 CA bal., % GDP Source: National authorities, Deutsche Bank Research 0.2 Deutsche Bank AG/London Page 41 EFTA01476081 8 December 2015 World Outlook 2016: Managing with less liquidity Bond Market Strategy: Peak policy divergence IIThe
0.25% 5.0% 2.5% 3% 6.5% 0.5% 1.5% 2.59 3.37 3.65 9.33 2.25 Figure 7: Our intrinsic valuation model S&P 500 Capi tal ized EPS Valuat ion Deutsche Bank's 2015E S&P 500 EPS DB's "normal 2015E" S&P 500 EPS EFTA01476121 "Normal 2015E" EPS / 2015E EPS Accounting quality adjustment to pro forma EPS No
implied ERP 10 15 20 25 30 35 0 5 Recession Implied ERP (rhs) Avg ERP ex 1975-82 = 3.5% Trailing PE (lhs) EFTA01476109 Avg ERP = 4% Avg PE = 15.9 Red dot shows implied ERP on 10yr TIPS yield of 1.5% instead of 0.28% currently Source: Deutsche Bank Research, IBES, S&P Overstated EPS f
2 mentions1 same-page
Page ?Same page
el. We set DPS equals to EPS and assume long-term growth is only inflation. Figure 42: Capitalize steady state earnings at the real cost of equity Deutsche Bank's 2015E S&P 500 EPS DB's "normal 2015E" S&P 500 EPS "Normal 2015E" EPS / 2015E EPS Accounting quality adjustment to pro forma EPS Normal 2015E S&P
15 20 25 30 35 0 5 Recession Implied ERP (rhs) Avg ERP ex 1975-82 = 3.5% Source: Deutsche Bank, S&P, IBES Trailing PE (lhs) Avg ERP = 4% Avg PE = 15.9 Overstated EPS from inflation distortions Low offered ERP contributes to crash Long-term growth optimism Return to normal 0% 2% 4%
Sponsored
Mutual Connections (30)
Entities connected to both Deutsche Bank and Avg PE
Bloomberg L.P.
ORGANIZATION130 w/ Deutsche·3 w/ Avg
Samantha Power
PERSON68 w/ Deutsche·2 w/ Avg
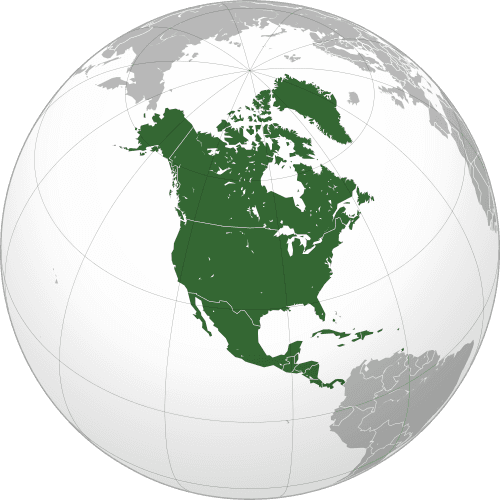
North America
LOCATION57 w/ Deutsche·2 w/ Avg
Brent
ORGANIZATION10 w/ Deutsche·2 w/ Avg
Utilities
ORGANIZATION7 w/ Deutsche·2 w/ Avg
DB
David Bianco
PERSON7 w/ Deutsche·2 w/ Avg
JW
Ju Wang
PERSON5 w/ Deutsche·3 w/ Avg
Air Freight & Logistics
ORGANIZATION5 w/ Deutsche·2 w/ Avg
Winnie Nip
PERSON4 w/ Deutsche·2 w/ Avg
Electric Utilities
ORGANIZATION4 w/ Deutsche·2 w/ Avg
Energy Equipment & Services
ORGANIZATION3 w/ Deutsche·2 w/ Avg
Sector and Industry Allocation
ORGANIZATION3 w/ Deutsche·2 w/ Avg
Auto Components
ORGANIZATION3 w/ Deutsche·2 w/ Avg
Compustat
ORGANIZATION3 w/ Deutsche·2 w/ Avg
Textiles, Apparel & Luxury Goods
ORGANIZATION3 w/ Deutsche·2 w/ Avg
Health Care Providers & Services
ORGANIZATION3 w/ Deutsche·2 w/ Avg
Road & Rail
ORGANIZATION3 w/ Deutsche·2 w/ Avg
Diversified Consumer Services
ORGANIZATION3 w/ Deutsche·2 w/ Avg
Hotels, Restaurants & Leisure
ORGANIZATION3 w/ Deutsche·2 w/ Avg
S&P EPS
ORGANIZATION3 w/ Deutsche·2 w/ Avg