Back to Network
4
Shared Docs
4
Same-Page
4 / 4
Mentions
Document Mentions (4 shared documents)
2 mentions1 same-page
Page ?Same page
on Key Players 40 Angola 40 Brazil 42 Canada 44 Caspian Sea, ex Russie 47 Colombia 49 U.S. Gulf of Mexico 51 Malaysia 54 Mexico 56 North Sea 59 Russia 61 Appendix 63 Page 2 Deutsche Bank Securities Inc. CONFIDENTIAL - PURSUANT TO FED. R. CRIM. P. 6(e) DB-SDNY-0058853 CONFIDENTIAL
Integrated Oils Table Of Contents Executive Summary 3 The Non-OPEC growth outlook to 2017 8 Looking for rapid declines? Don't hold your breath Non-OPEC growth: Late to the party 8 Where is the growth coming from? 10 Capex Reductions 15 Show me the money (or lack thereof) 15 Setting the stage
2 mentions1 same-page
Page ?Same page
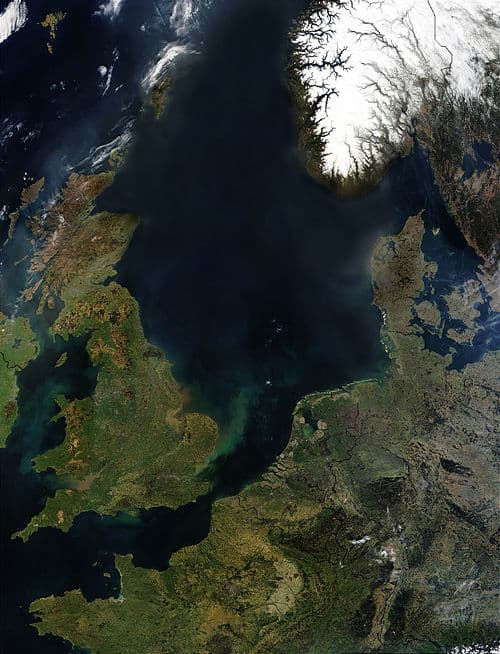
f the larger global picture. Largely synonymous with mature declining assets, averaging 6% YoY decline since 2002 (vs 9% for the UK), the Norwegian North Sea will actually see production flat to slightly increasing through 2017. Driving this is a significant increase in major project growth barrels, with
017, we estimate annual, major project-driven growth barrels of 1380 Mb/d, vs. the historical rate of 970 Mb/d between 2004- 2013, supporting annual Non-OPEC supply growth of 500 Mb/d through 2017. Leading drivers: US GoM, Brazil, Canada, and slower declines on recent redevelopment projects in the North
2 mentions1 same-page
Page ?Same page
Colombia • Non-OPEC Africa • Non-OPEC Middle East • Australia • Malaysia ell Indonesia • Other Non-OECD Asia • Russia • Caspian Sea i Total North Sea a Other Non-OPEC Latin America • Other i Mexico • China i India OTotal Canada 0 Brazil ▪ n'ell.11 Through 2017, the vast majority of this g
31 May 2015 Integrated Oil US Integrated Oils Figure 15: Brazil and Canada: Exclude them and Non-OPEC crude production is down -1500 MMIard horn 2014-2020. include them and production is up 400 Mbid 43000 38000 r , 1 . 1 r________, 23000 180
Sponsored
2 mentions1 same-page
Page ?Same page
020. Figure 13: ,_014-20 I 7 Cumulative Growth (Mbid) Figure 14 2014.2020 Cumulative Growth (Mbrkt Mexico MI Non-OPEC Mickile East Colombia ■ North Sea • Alaska r Caspian Sea India Europe Non-OECD Other Non-OECD Asia Angola Other FSU Australia Other Non-OPEC Latin America Other Europe OE
cted to be relatively flat through 2020. Figure 13: ,_014-20 I 7 Cumulative Growth (Mbid) Figure 14 2014.2020 Cumulative Growth (Mbrkt Mexico MI Non-OPEC Mickile East Colombia ■ North Sea • Alaska r Caspian Sea India Europe Non-OECD Other Non-OECD Asia Angola Other FSU Australia Other Non
Sponsored
Mutual Connections (6)
Entities connected to both North Sea and Non-OPEC