Back to Network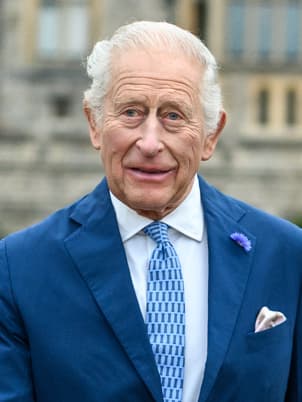

4
Shared Docs
4
Same-Page
4 / 4
Mentions
Document Mentions (4 shared documents)
2 mentions1 same-page
Page ?Same page
edistribution. Please refer to the endnotes on p.3 for additional information. Past performance is not an indication or guarantee offuture results Joshua C. Glaser Partner, Client Relations +1-212-653-8402 [email protected] Total • 1.00% p.a. of Invested Capitalll in the following two years
OF II and SOF III performance against one benchmark only; quartiles may differ when compared to other benchmarking sources. SOF, SOF D, SOF II and SOF III data is not included in the data set used to calculate the benchmark data. (6) Information presented in this chart is based on the unaudited result
2 mentions1 same-page
Page ?Same page
edistribution. Please refer to the endnotes on p.3 for additional information. Past performance is not an indication or guarantee offuture results Joshua C. Glaser Partner, Client Relations Total • 1.00% p.a. of Invested Capitalll in the following two years US$2,980m • Thereafter greater of 90% of previou
OF II and SOF III performance against one benchmark only; quartiles may differ when compared to other benchmarking sources. SOF, SOF D, SOF II and SOF III data is not included in the data set used to calculate the benchmark data. (6) Information presented in this chart is based on the unaudited result
Sponsored
Mutual Connections (154)
Entities connected to both Joshua C. Glaser and SOF III
Credit Suisse Asset Management Limited
ORGANIZATION30 w/ Joshua·4 w/ SOF
CP
Carlo Pirzio-Biroli
PERSON23 w/ Joshua·4 w/ SOF
Glendower
LOCATION14 w/ Joshua·12 w/ SOF
CS
Charles Smith
PERSON14 w/ Joshua·8 w/ SOF
DD
Deirdre Davies
PERSON14 w/ Joshua·8 w/ SOF
Prince Charles
PERSON14 w/ Joshua·8 w/ SOF
CC
Chi Cheung
PERSON14 w/ Joshua·8 w/ SOF
Glendower Capital
ORGANIZATION15 w/ Joshua·4 w/ SOF
AG
Adam Graev
PERSON14 w/ Joshua·4 w/ SOF
United Kingdom
LOCATION14 w/ Joshua·4 w/ SOF
Glendower Capital SOF IV
ORGANIZATION14 w/ Joshua·4 w/ SOF
Gallo & Co.
ORGANIZATION9 w/ Joshua·8 w/ SOF
Access Fund
ORGANIZATION9 w/ Joshua·8 w/ SOF
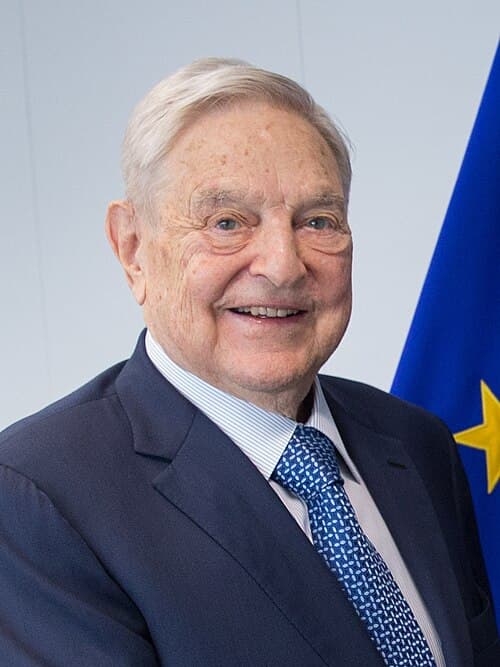
George Soros
PERSON9 w/ Joshua·8 w/ SOF
SOF IV
ORGANIZATION9 w/ Joshua·8 w/ SOF
United States
LOCATION9 w/ Joshua·8 w/ SOF
J. Robert Oppenheimer
PERSON9 w/ Joshua·8 w/ SOF
General Electric
ORGANIZATION9 w/ Joshua·8 w/ SOF
North America
LOCATION9 w/ Joshua·4 w/ SOF
Guernsey
LOCATION9 w/ Joshua·4 w/ SOF