Back to Network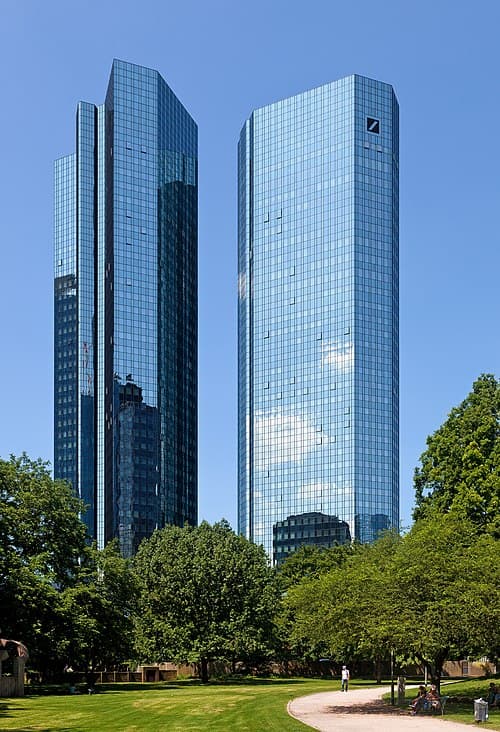
5
Shared Docs
5
Same-Page
5 / 5
Mentions
Document Mentions (5 shared documents)
2 mentions1 same-page
Page ?Same page
F, SOF D, SOF II and SOF III (collectively the "SOF Funds" or the "SOF Program") with aggregate commitments of US$3 billion. More specifically: \Z SOF,3 the initial SOF Program secondary fund that was formed in 2006 and held a final close in early 2007 with a US$565 million pool of commitments. )Z
mber 30, 2017). The SOF Funds present comparatively strong Net IRR, DPI and TVPI across each vintage year. Exhibit 2: SOF Funds performance versus Cambridge Associates Secondary Fund Benchmark34, 35, 36, 37 In Exhibit 3, each of SOF, SOF D, SOF II and SOF III is benchmarked against its vintage group of top quartile buyout fund
Sponsored
2 mentions1 same-page
Page ?Same page
F, SOF D, SOF II and SOF III (collectively the "SOF Funds" or the "SOF Program") with aggregate commitments of US$3 billion. More specifically: \Z SOF,3 the initial SOF Program secondary fund that was formed in 2006 and held a final close in early 2007 with a US$565 million pool of commitments. )Z
mber 30, 2017). The SOF Funds present comparatively strong Net IRR, DPI and TVPI across each vintage year. Exhibit 2: SOF Funds performance versus Cambridge Associates Secondary Fund Benchmark34, 35, 36, 37 In Exhibit 3, each of SOF, SOF D, SOF II and SOF III is benchmarked against its vintage group of top quartile buyout fund
Sponsored
Mutual Connections (148)
Entities connected to both SOF,3 and Cambridge Associates Secondary Fund
DD
Deirdre Davies
PERSON16 w/ SOF,3·5 w/ Cambridge
AG
Adam Graev
PERSON16 w/ SOF,3·5 w/ Cambridge
CS
Charles Smith
PERSON16 w/ SOF,3·5 w/ Cambridge
Deutsche Bank
ORGANIZATION16 w/ SOF,3·5 w/ Cambridge
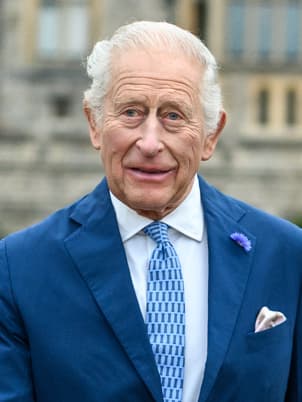
Prince Charles
PERSON16 w/ SOF,3·5 w/ Cambridge
Glendower
LOCATION16 w/ SOF,3·5 w/ Cambridge
SOF IV
ORGANIZATION16 w/ SOF,3·5 w/ Cambridge
CC
Chi Cheung
PERSON16 w/ SOF,3·5 w/ Cambridge
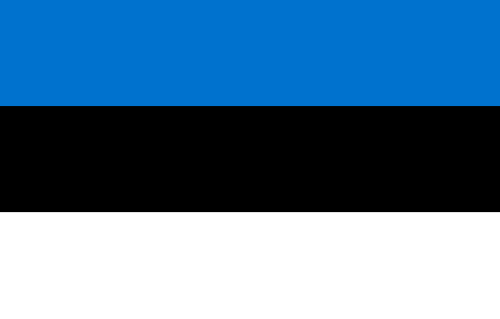
Estonia
LOCATION5 w/ SOF,3·5 w/ Cambridge
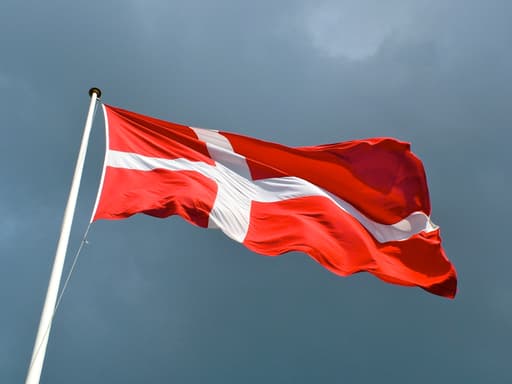
Denmark
LOCATION5 w/ SOF,3·5 w/ Cambridge
Finland
LOCATION5 w/ SOF,3·5 w/ Cambridge
Pretoria
LOCATION5 w/ SOF,3·5 w/ Cambridge
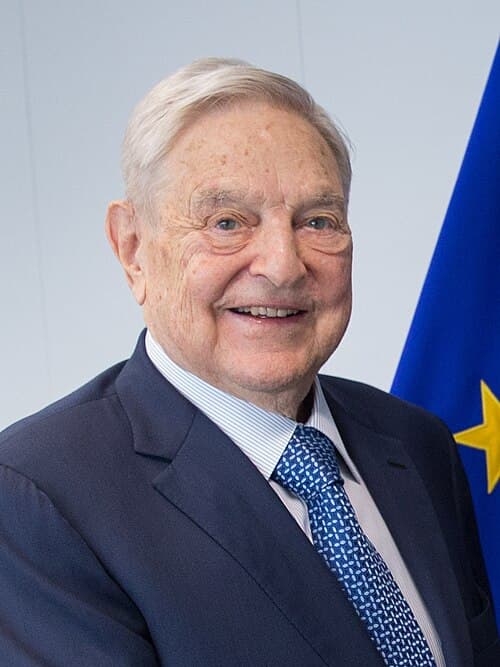
George Soros
PERSON5 w/ SOF,3·5 w/ Cambridge
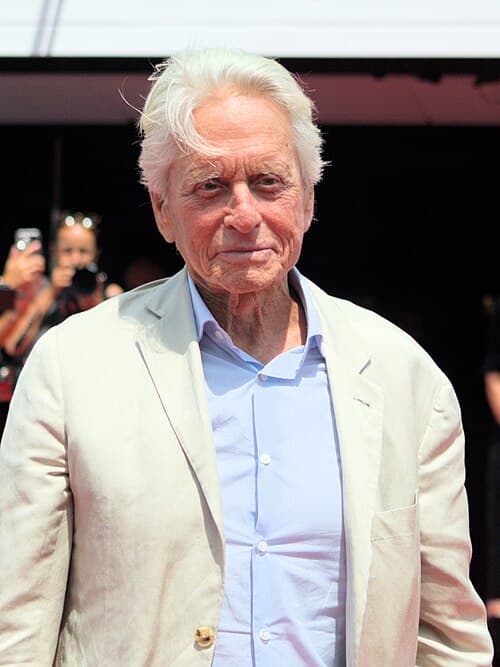
Michael Douglas
PERSON5 w/ SOF,3·5 w/ Cambridge
European Union
ORGANIZATION5 w/ SOF,3·5 w/ Cambridge
Romania
LOCATION5 w/ SOF,3·5 w/ Cambridge
Lithuania
LOCATION5 w/ SOF,3·5 w/ Cambridge
Cyprus
LOCATION5 w/ SOF,3·5 w/ Cambridge
Elena
PERSON5 w/ SOF,3·5 w/ Cambridge
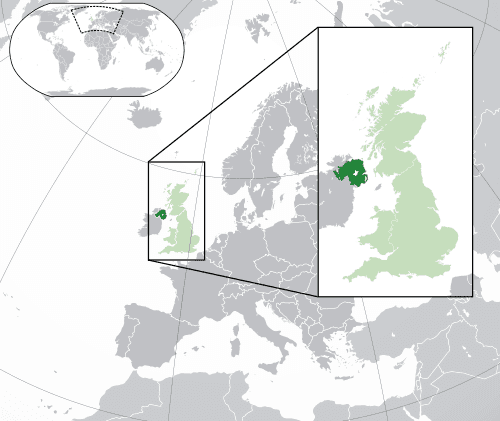
Northern Ireland
LOCATION5 w/ SOF,3·5 w/ Cambridge