Back to Network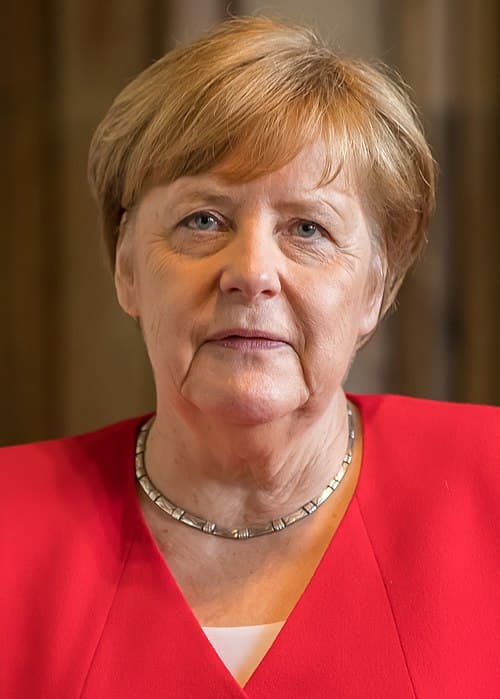
9
Shared Docs
9
Same-Page
9 / 9
Mentions
Document Mentions (9 shared documents)
2 mentions1 same-page
Page ?Same page
ive of the primary market. Exhibit 9: Total PE assets have risen to USS2.8 trillion53 Exhibit 10: Annual Secondary volumes now 1-2% of total PEsO Leith ).060 2.500 1 503 =mull. - 2007 2008 2009 2010 2011 2012 2013 2014 2015 2016 2017 • Wroarised 0011.616 vat,. Orypow6e/ 2 2% - 2 0% - 1 II%
e) traded at significantly larger discounts. There is an even greater price gap for perceived -out-of-favor funds and lower-quality managers. It is Glendower's opinion that staying focused on bottom-up fund and asset selection, often resulting in acquiring one or only a few funds from a given seller. may
2 mentions1 same-page
Page ?Same page
ive of the primary market. Exhibit 9: Total PE assets have risen to USS2.8 trillion53 Exhibit 10: Annual Secondary volumes now 1-2% of total PEsO Leith 3.0M Zeoo 1 503 =mull. - 2007 2008 2009 2010 2011 2012 2013 2014 2013 2016 2017 • Umansed *we'd* vat,. Dry pow6/ 2 2% - 20% - 18% I6% .
e) traded at significantly larger discounts. There is an even greater price gap for perceived 'out-of-favor funds and lower-quality managers. It is Glendower's opinion that staying focused on bottom-up fund and asset selection, often resulting in acquiring one or only a few funds from a given seller. may
2 mentions1 same-page
Page ?Same page
ive of the primary market. Exhibit 9: Total PE assets have risen to USS2.8 trillion53 Exhibit 10: Annual Secondary volumes now 1-2% of total PEsO Leith ).060 2.500 1 503 =mull. - 2007 2008 2009 2010 2011 2012 2013 2014 2015 2016 2017 • Wroarised 0011.616 vat,. Orypow6e/ 2 2% - 2 0% - 1 II%
e) traded at significantly larger discounts. There is an even greater price gap for perceived -out-of-favor funds and lower-quality managers. It is Glendower's opinion that staying focused on bottom-up fund and asset selection, often resulting in acquiring one or only a few funds from a given seller. may
Sponsored
2 mentions1 same-page
Page ?Same page
ive of the primary market. Exhibit 9: Total PE assets have risen to USS2.8 trillion53 Exhibit 10: Annual Secondary volumes now 1-2% of total PEsO Leith ).060 2.500 1 503 =mull. - 2007 2008 2009 2010 2011 2012 2013 2014 2015 2016 2017 • Wroarised 0011.616 vat,. Orypow6e/ 2 2% - 2 0% - 1 II%
e) traded at significantly larger discounts. There is an even greater price gap for perceived -out-of-favor funds and lower-quality managers. It is Glendower's opinion that staying focused on bottom-up fund and asset selection, often resulting in acquiring one or only a few funds from a given seller. may
2 mentions1 same-page
Page ?Same page
ive of the primary market. Exhibit 9: Total PE assets have risen to USS2.8 trillion53 Exhibit 10: Annual Secondary volumes now 1-2% of total PEsO Leith 000 Zee, 1 503 =mull. - 2007 2008 2009 2010 2011 2012 2013 2014 2015 2016 2017 • Umansed 0oado vat,. Dry pow6e/ 2 2% - 2 0% - I a% - 16%
e) traded at significantly larger discounts. There is an even greater price gap for perceived -out-of-favor funds and lower-quality managers. It is Glendower's opinion that staying focused on bottom-up fund and asset selection, often resulting in acquiring one or only a few funds from a given seller. may
2 mentions1 same-page
Page ?Same page
ive of the primary market. Exhibit 9: Total PE assets have risen to USS2.8 trillion53 Exhibit 10: Annual Secondary volumes now 1-2% of total PEsO Leith ).060 2.sea 1 503 =mull. - 2007 2008 2009 2010 2011 2012 2013 2014 2015 2016 2017 • Wroarised 04411.41.0 va14e Dry pcw6e/ 2 2% - 2 0% - 1
e) traded at significantly larger discounts. There is an even greater price gap for perceived -out-of-favor funds and lower-quality managers. It is Glendower's opinion that staying focused on bottom-up fund and asset selection, often resulting in acquiring one or only a few funds from a given seller. may
Sponsored
2 mentions1 same-page
Page ?Same page
ive of the primary market. Exhibit 9: Total PE assets have risen to USS2.8 tfillion53 Exhibit 10: Annual Secondary volumes now 1-2% of total PEsO Leith ).0M idea 1 503 =mull. - 2007 2008 2009 2010 2011 2012 2013 2014 2015 2016 2017 • Umansed *we'd* vat,. Dry pow6/ 2 2% - 20% - 18% 16% •
e) traded at significantly larger discounts. There is an even greater price gap for perceived 'out-of-favor funds and lower-quality managers. It is Glendower's opinion that staying focused on bottom-up fund and asset selection, often resulting in acquiring one or only a few funds from a given seller. may
2 mentions1 same-page
Page ?Same page
ive of the primary market. Exhibit 9: Total PE assets have risen to USS2.8 trillion53 Exhibit 10: Annual Secondary volumes now 1-2% of total PEsO Leith 000 Zam 1 503 =mull. - 2007 2008 2009 2010 2011 2012 2013 2014 2015 2016 2017 • Umansed 0o6do vat,. Dry pow6e/ 2 2% - 2 0% - I 8% - I 8%
e) traded at significantly larger discounts. There is an even greater price gap for perceived -out-of-favor funds and lower-quality managers. It is Glendower's opinion that staying focused on bottom-up fund and asset selection, often resulting in acquiring one or only a few funds from a given seller. may
2 mentions1 same-page
Page ?Same page
ive of the primary market. Exhibit 9: Total PE assets have risen to USS2.8 trillion53 Exhibit 10: Annual Secondary volumes now 1-2% of total PEsO Leith 3.060 Zeim 1 503 =mull. - 2007 2008 2009 2010 2011 2012 2013 2014 2013 2016 2017 • Wroarised 0011'do va14e Dry pcw6e/ 2 2% - 2 0% - 1 -
e) traded at significantly larger discounts. There is an even greater price gap for perceived -out-of-favor funds and lower-quality managers. It is Glendower's opinion that staying focused on bottom-up fund and asset selection, often resulting in acquiring one or only a few funds from a given seller. may
Sponsored
Mutual Connections (11)
Entities connected to both Leith and Glendower
Glendower Capital
ORGANIZATION2 w/ Leith·318 w/ Glendower
GR
Greenhill
PERSON9 w/ Leith·41 w/ Glendower
Venture Capital Report
ORGANIZATION9 w/ Leith·17 w/ Glendower
Greenns Secondary Market
ORGANIZATION8 w/ Leith·8 w/ Glendower
Iunds
ORGANIZATION5 w/ Leith·8 w/ Glendower
Angela Merkel
PERSON3 w/ Leith·8 w/ Glendower
the Secondary Markel
ORGANIZATION5 w/ Leith·6 w/ Glendower
Cow Jones Private Equity
ORGANIZATION3 w/ Leith·4 w/ Glendower
AG
Analylt Gude
PERSON2 w/ Leith·5 w/ Glendower
GC
Glendower Captal
PERSON2 w/ Leith·3 w/ Glendower
AG
Analyit Gude
PERSON2 w/ Leith·2 w/ Glendower