Back to Network

4
Shared Docs
4
Same-Page
4 / 4
Mentions
Document Mentions (4 shared documents)
2 mentions1 same-page
Page ?Same page
LLC 5/1/2014 Historical Net Exposure by Geography (Listed Equities) & Macro (Equity Indices & Commodites, G20 Gov. Credit) —APAC —EMEA —AMER — EquityCom —G20 Rates , ,NexEposule REG 0000,000 3,000.030 4,000.000 3030000 0000.000 1,030000 0 Moscow) (2,000,000) 0500000 0000,000 500000 t•e
,047 7,836 #N/A N/A 39.30 0.99% SI US Equity 635 5,671 118.49 131.76 13.37 0.84% 5.91 SIE GR Equity 777 5,345 #N/A N/A 18.43 0.79% SLB US Equity 1,731 8,483 83.83 100.94 28.81 0.71% (52.30) SMSN LI Equity 3 (2,599) 644.63 644.00 0.09 1.07% (8.21) SO US Equity 291 11,861 44.1
2 mentions1 same-page
Page ?Same page
ftc." . . . O4.1. O° O. Si' IP O1 CI' Nci At le re Ole O• N. 0) (,) ek 4, O Ole N. 1) 1 1 b 'LO N. „,N. — APAC — EMEA AMER —EquityCom Credit Istorical Gross Exposure by Geography (Listed Equities) & Macro (Equity Indices & Commodlites, G20 Gov. Credit) 2,500,000 2,000,000 1,5
7,797 43.91 51.82 22.13 0.81% SI US Equity 971 11,342 114.69 124.51 10.83 0.79% SIE GR Equity 755 8,973 114.68 124.34 9.94 0.85% SLB US Equity 535 6,585 79.94 86.43 10.49 0.77% SMSN LI Equity 788 (7,313) 644.51 575.06 11.67 0.92% SO US Equity 186 (9,078) 41.73 40.88 4.44
2 mentions1 same-page
Page ?Same page
uities) & Macro (Equity Indices & Commodites, G20 Gov. Credit) 6,000,000 5,004000 6,000,C00 3,000.000 2,000.000 1,000,C00 ,. A mc EMEA AMER EquityCom —G20 Rates NexEposure REIS 3.000,000 1500,000 1.000,000 t % (Seat ) CIG 60-rr r~ • sc. I N.c. \ . \ • \ \ \ \ \1` \ \ \ \ (2,0
33.23 1.01% 41.98 SI US Equity 803 5,671 118.49 135.26 17.73 0.80% 97.30 SIE GR Equity 938 5,345 114.81 134.96 21.79 0.81% 83.55 SLB US Equity 1,669 8,679 84.17 100.35 34.85 0.55% 23.30 SMSN LI Equity (85) (1,949) 644.63 672.79 .4.62 0.95% (61.51) SO US Equity (192) 11,861
Sponsored
2 mentions1 same-page
Page ?Same page
phy (Listed Equities) & Macro (Equity Indices & Commodites, G20 Gov. Credit) 6.000.030 4,000.030 L030.030 2,000.000 1,000.000 APAC DMA —AMER EquityCom 7.000,000 1.500,000 t 5,000.000 1,001,000 —G20 Rates , NexEposure MIS (*. 03 iStc (S cli, \N.c \ 4,1" 15;4> ettcPsycP le .153 4 09", 4 Sb
40 1.00% (5.13) SI US Equity 775 5,671 118.49 134.69 16.39 0.83% (83.56) SIE GR Equity 941 5,345 114.81 135.03 21.98 0.80% (68.71) SLB US Equity 1,716 8,679 84.17 100.81 34.79 0.57% 54.04 SMSN LI Equity (40) (650) 644.63 684.20 -6.50 0.94% (3.69) SO US Equity (99) 11,861 44.
Sponsored
Mutual Connections (10)
Entities connected to both EquityCom and SLB US Equity
Ghislaine Maxwell
PERSON57 w/ EquityCom·5 w/ SLB
AT
Atorus
PERSON54 w/ EquityCom·5 w/ SLB
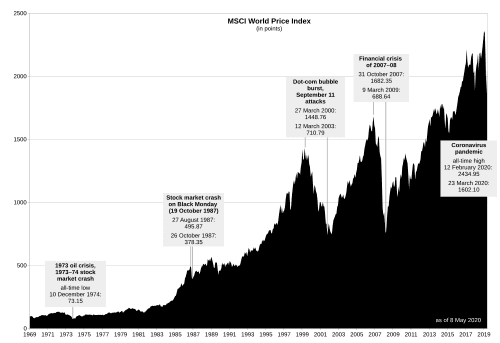
MSCI World
ORGANIZATION48 w/ EquityCom·3 w/ SLB
Current Portfolio -Listed Equity Portfolio
ORGANIZATION41 w/ EquityCom·4 w/ SLB
AU TSY
ORGANIZATION40 w/ EquityCom·3 w/ SLB
ENI IM Equity
ORGANIZATION31 w/ EquityCom·4 w/ SLB
MSCI World Change
ORGANIZATION31 w/ EquityCom·3 w/ SLB
Emmanuel Macron
PERSON29 w/ EquityCom·3 w/ SLB
SMSN LI Equity
ORGANIZATION16 w/ EquityCom·2 w/ SLB
GE US Equity
ORGANIZATION10 w/ EquityCom·3 w/ SLB