Back to Network



11
Shared Docs
11
Same-Page
11 / 11
Mentions
Document Mentions (11 shared documents)
2 mentions1 same-page
Page ?Same page
2017 ATM LQD vol is around 7.5% so a 100% Put costs —3.2% which given the long term chart below and all time high in shares outstanding looks cheap. Chart One shows hourly data of IEF (7.10y US Treasury ETF) and SPY (S&P500 ETF). Using 60 hourly data points, correlation has moved from around -80% a month ag
Put costs —3.2% which given the long term chart below and all time high in shares outstanding looks cheap. Chart One shows hourly data of IEF (7.10y US Treasury ETF) and SPY (S&P500 ETF). Using 60 hourly data points, correlation has moved from around -80% a month ago to zero now. This means the volatility/levera
2 mentions1 same-page
Page ?Same page
2017 ATM LQD vol is around 7.5% so a 100% Put costs —12% which given the long term chart below and all time high in shares outstanding looks cheap. Chart One shows hourly data of IEF (7.10y US Treasury ETF) and SPY (S&P500 ETF). Using 60 hourly data points, correlation has moved from around -80% a month ag
Put costs —12% which given the long term chart below and all time high in shares outstanding looks cheap. Chart One shows hourly data of IEF (7.10y US Treasury ETF) and SPY (S&P500 ETF). Using 60 hourly data points, correlation has moved from around -80% a month ago to zero now. This means the volatility/levera
2 mentions1 same-page
Page ?Same page
2017 ATM LQD vol is around 7.5% so a 100% Put costs —12% which given the long term chart below and all time high in shares outstanding looks cheap. Chart One shows hourly data of IEF (7.10y US Treasury ETF) and SPY (S&P500 ETF). Using 60 hourly data points, correlation has moved from around -80% a month ag
Put costs —12% which given the long term chart below and all time high in shares outstanding looks cheap. Chart One shows hourly data of IEF (7.10y US Treasury ETF) and SPY (S&P500 ETF). Using 60 hourly data points, correlation has moved from around -80% a month ago to zero now. This means the volatility/levera
Sponsored
2 mentions1 same-page
Page ?Same page
017 ATM LQD vol is around 7.5% s= a 100% Put costs —3.2% which given the long term chart below and all time high in shares outstanding looks cheap. Chart One shows hourly data of IEF (7-1=y US Treasury ETF) and SPY (S&P500 ETF). Using 60 hourly data points, =orrelation has moved from around -80% a month a
ut costs —3.2% which given the long term chart below and all time high in shares outstanding looks cheap. Chart One shows hourly data of IEF (7-1=y US Treasury ETF) and SPY (S&P500 ETF). Using 60 hourly data points, =orrelation has moved from around -80% a month ago to zero now. This means the volatil=ty/levera
2 mentions1 same-page
Page ?Same page
017 ATM LQD vol is around 7.5% s= a 100% Put costs —3.2% which given the long term chart below and all time=high in shares outstanding looks cheap. Chart One shows hourly data of IEF (7-1=y US Treasury ETF) and SPY (S&P500 ETF). Using 60 hourly data points, =orrelation has moved from around -80% a month a
ut costs —3.2% which given the long term chart below and all time=high in shares outstanding looks cheap. Chart One shows hourly data of IEF (7-1=y US Treasury ETF) and SPY (S&P500 ETF). Using 60 hourly data points, =orrelation has moved from around -80% a month ago to zero now. This means the volatility/levera
2 mentions1 same-page
Page ?Same page
017 ATM LQD vol is around 7.5% s= a 100% Put costs —3.2% which given the long term chart below and all time high in shares outstanding looks cheap. Chart One shows hourly data of IEF (7-1=y US Treasury ETF) and SPY (S&P500 ETF). Using 60 hourly data points, =orrelation has moved from around -80%a month ag
ut costs —3.2% which given the long term chart below and all time high in shares outstanding looks cheap. Chart One shows hourly data of IEF (7-1=y US Treasury ETF) and SPY (S&P500 ETF). Using 60 hourly data points, =orrelation has moved from around -80%a month ago to zero now. This means the volatil=ty/leverag
Sponsored
2 mentions1 same-page
Page ?Same page
017 ATM LQD vol is around 7.5% so a 100% Put costs —3.2% which given the long term chart below and all time high in shares outstanding looks cheap. Chart One shows hourly data of IEF (7-10y US Treasury ETF) and SPY (S&P500 ETF). Using 60 hourly data points, correlation has moved from around -80% a month a
ut costs —3.2% which given the long term chart below and all time high in shares outstanding looks cheap. Chart One shows hourly data of IEF (7-10y US Treasury ETF) and SPY (S&P500 ETF). Using 60 hourly data points, correlation has moved from around -80% a month ago to zero now. This means the volatility/lever
2 mentions1 same-page
Page ?Same page
017 ATM LQD vol is around 7.5% so a 100% Put costs —3.2% which given the long term chart below and all time high in shares outstanding looks cheap. Chart One shows hourly data of IEF (7.10y US Treasury ETF) and SPY (S&P500 ETF). Using 60 hourly data points, correlation has moved from around -80% a month a
ut costs —3.2% which given the long term chart below and all time high in shares outstanding looks cheap. Chart One shows hourly data of IEF (7.10y US Treasury ETF) and SPY (S&P500 ETF). Using 60 hourly data points, correlation has moved from around -80% a month ago to zero now. This means the volatility/levera
2 mentions1 same-page
Page ?Same page
17 ATM LQD vol is around 7.5% so a 100% Put costs - 3.2% which given the long term chart below and all time high in shares outstanding looks cheap. Chart One shows hourly data of IEF (7-10y US Treasury ETF) and SPY (S&P500 ETF). Using 60 hourly data points, correlation has moved from around -80% a month a
t costs - 3.2% which given the long term chart below and all time high in shares outstanding looks cheap. Chart One shows hourly data of IEF (7-10y US Treasury ETF) and SPY (S&P500 ETF). Using 60 hourly data points, correlation has moved from around -80% a month ago to zero now. This means the volatility/levera
Sponsored
2 mentions1 same-page
Page ?Same page
017 ATM LQD vol is around 7.5% s= a 100% Put costs -3.2% which given the long term chart below and all time high in shares outstanding looks cheap. Chart One shows hourly data of IEF (7-1=y US Treasury ETF) and SPY (S&P500 ETF). Using 60 hourly data points, =orrelation has moved from around -80% a month a
ut costs -3.2% which given the long term chart below and all time high in shares outstanding looks cheap. Chart One shows hourly data of IEF (7-1=y US Treasury ETF) and SPY (S&P500 ETF). Using 60 hourly data points, =orrelation has moved from around -80% a month ago to zero now. This means the volatil=ty/levera
Sponsored
Mutual Connections (35)
Entities connected to both Chart One and US Treasury ETF
Bloomberg L.P.
ORGANIZATION11 w/ Chart·11 w/ US
Investment Grade ETF
ORGANIZATION11 w/ Chart·11 w/ US
Paul Volcker
PERSON11 w/ Chart·11 w/ US
Investment Grade Supply
ORGANIZATION11 w/ Chart·11 w/ US
S&P500 ETF
ORGANIZATION11 w/ Chart·11 w/ US
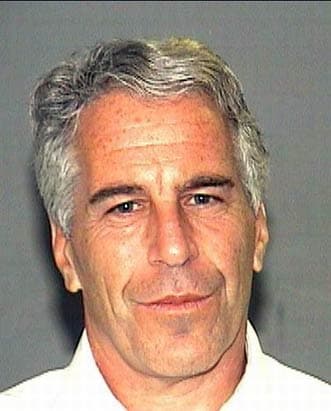
Jeffrey Epstein
PERSON11 w/ Chart·11 w/ US
Richard Kahn
PERSON11 w/ Chart·11 w/ US
Teva Pharma
ORGANIZATION11 w/ Chart·11 w/ US
HM
Hans Mikkelsen
PERSON11 w/ Chart·11 w/ US
Frontier Communications
ORGANIZATION11 w/ Chart·11 w/ US
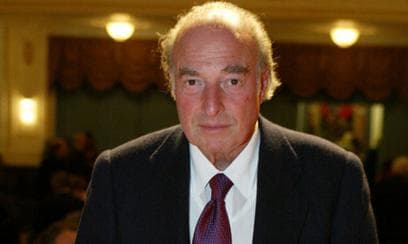
Marc Rich
PERSON11 w/ Chart·11 w/ US
Frontier Comm
ORGANIZATION10 w/ Chart·10 w/ US
Spec Pharma
ORGANIZATION10 w/ Chart·10 w/ US
Allergan
LOCATION9 w/ Chart·9 w/ US
AM
Amanda
PERSON8 w/ Chart·8 w/ US
AE
Amanda Ens
PERSON7 w/ Chart·7 w/ US
PR
Pfd Return
PERSON7 w/ Chart·7 w/ US
Bloomberg: Junk Debt Keeps Climbing Despite Plunging Oil Prices
ORGANIZATION6 w/ Chart·6 w/ US
Non-Farm Payrolls
ORGANIZATION6 w/ Chart·6 w/ US
Outlook
ORGANIZATION6 w/ Chart·6 w/ US