Back to Network

5
Shared Docs
5
Same-Page
5 / 5
Mentions
Document Mentions (5 shared documents)
2 mentions1 same-page
Page ?Same page
a and Pacific 3% and the rest of the world 4%.45 \Z Sellers of the assets purchased by the SOF Funds were located in (by value) North America 43%, Western Europe 55% and the rest of the world 3%.46 The Manager expects to leverage non-monetary factors, such as confidentiality, trust, speed and certainty of e
er 30, 2017 the SOF Program has delivered a strong performance with aggregate gross performance since inception of 1.6x gross multiple and 28% IRR (Internal Rate of Return) and 1.5x TVPI (Total Value to Paid-in Capital), 0.9x DPI (Distributions to Paid-in Capital) and 23% Net IRR to investors. More specifically: SOF
2 mentions1 same-page
Page ?Same page
a and Pacific 3% and the rest of the world 4%.45 \Z Sellers of the assets purchased by the SOF Funds were located in (by value) North America 43%, Western Europe 55% and the rest of the world 3%.46 The Manager expects to leverage non-monetary factors, such as confidentiality, trust, speed and certainty of e
er 30, 2017 the SOF Program has delivered a strong performance with aggregate gross performance since inception of 1.6x gross multiple and 28% IRR (Internal Rate of Return) and 1.5x TVPI (Total Value to Paid-in Capital), 0.9x DPI (Distributions to Paid-in Capital) and 23% Net IRR to investors. More specifically: SOF
2 mentions1 same-page
Page ?Same page
a and Pacific 3% and the rest of the world 4%.45 \Z Sellers of the assets purchased by the SOF Funds were located in (by value) North America 43%, Western Europe 55% and the rest of the world 3%.46 The Manager expects to leverage non-monetary factors, such as confidentiality, trust, speed and certainty of e
er 30, 2017 the SOF Program has delivered a strong performance with aggregate gross performance since inception of 1.6x gross multiple and 28% IRR (Internal Rate of Return) and 1.5x TVPI (Total Value to Paid-in Capital), 0.9x DPI (Distributions to Paid-in Capital) and 23% Net IRR to investors. More specifically: SOF
Sponsored
2 mentions1 same-page
Page ?Same page
a and Pacific 3% and the rest of the world 4%.45 \Z Sellers of the assets purchased by the SOF Funds were located in (by value) North America 43%, Western Europe 55% and the rest of the world 3%.46 The Manager expects to leverage non-monetary factors, such as confidentiality, trust, speed and certainty of e
er 30, 2017 the SOF Program has delivered a strong performance with aggregate gross performance since inception of 1.6x gross multiple and 28% IRR (Internal Rate of Return) and 1.5x TVPI (Total Value to Paid-in Capital), 0.9x DPI (Distributions to Paid-in Capital) and 23% Net IRR to investors. More specifically: SOF
2 mentions1 same-page
Page ?Same page
a and Pacific 3% and the rest of the world 4%.45 \Z Sellers of the assets purchased by the SOF Funds were located in (by value) North America 43%, Western Europe 55% and the rest of the world 3%.46 The Manager expects to leverage non-monetary factors, such as confidentiality, trust, speed and certainty of e
er 30, 2017 the SOF Program has delivered a strong performance with aggregate gross performance since inception of 1.6x gross multiple and 28% IRR (Internal Rate of Return) and 1.5x TVPI (Total Value to Paid-in Capital), 0.9x DPI (Distributions to Paid-in Capital) and 23% Net IRR to investors. More specifically: SOF
Sponsored
Mutual Connections (157)
Entities connected to both Western Europe and Internal Rate of Return
North America
LOCATION45 w/ Western·17 w/ Internal
United States
LOCATION49 w/ Western·5 w/ Internal
Glendower
LOCATION22 w/ Western·23 w/ Internal
the SOF Program
ORGANIZATION17 w/ Western·27 w/ Internal
Prince Charles
PERSON19 w/ Western·23 w/ Internal
Julie K. Brown
PERSON31 w/ Western·5 w/ Internal
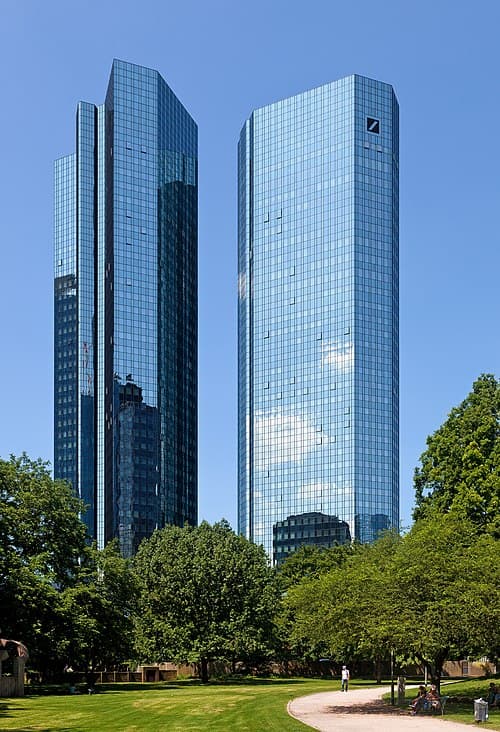
Deutsche Bank
ORGANIZATION8 w/ Western·21 w/ Internal
DD
Deirdre Davies
PERSON5 w/ Western·23 w/ Internal
CS
Charles Smith
PERSON5 w/ Western·22 w/ Internal
Glendower Capital
ORGANIZATION8 w/ Western·19 w/ Internal
United Kingdom
LOCATION21 w/ Western·5 w/ Internal
Norway
LOCATION21 w/ Western·5 w/ Internal
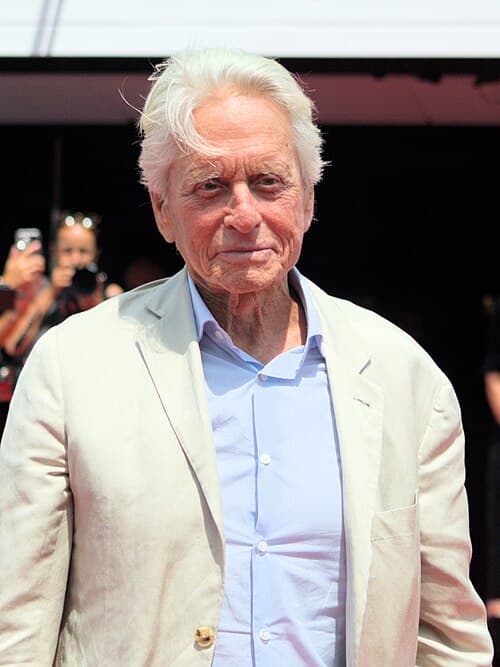
Michael Douglas
PERSON21 w/ Western·5 w/ Internal
The Glendower SOF Team
ORGANIZATION17 w/ Western·9 w/ Internal
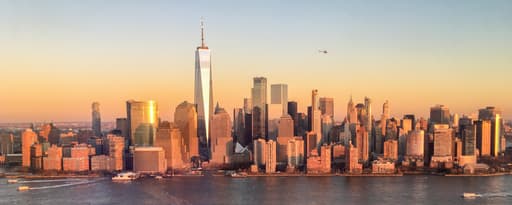
New York
LOCATION20 w/ Western·5 w/ Internal
Belgium
LOCATION19 w/ Western·5 w/ Internal
SOF IV
ORGANIZATION5 w/ Western·18 w/ Internal
Finland
LOCATION16 w/ Western·5 w/ Internal
Hungary
LOCATION15 w/ Western·5 w/ Internal
Denmark
LOCATION15 w/ Western·5 w/ Internal