Back to Network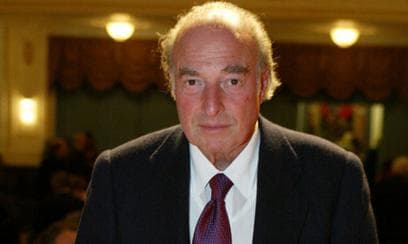



11
Shared Docs
11
Same-Page
11 / 11
Mentions
Document Mentions (11 shared documents)
2 mentions1 same-page
Page ?Same page
lphabet — $ 2 billion Chart Two shows Investment Grade ETF, LQD, is at the top of a long term range with shares outstanding around an all time high. Hans Mikkelsen noted on Friday in "Credit Market qtrategist" with Japanese inflows into IG market already at max strength there are mostly downside risks to US cre
n the long term chart below and all time high in shares outstanding looks cheap. Chart One shows hourly data of IEF (7.10y US Treasury ETF) and SPY (S&P500 ETF). Using 60 hourly data points, correlation has moved from around -80% a month ago to zero now. This means the volatility/leverage of risk panty port
2 mentions1 same-page
Page ?Same page
lphabet — $ 2 billion Chart Two shows Investment Grade ETF, LQD, is at the top of a long term range with shares outstanding around an all time high. Hans Mikkelsen noted on Friday in "Credit Market Strateulg: with Japanese inflows into IG market already at max strength there are mostly downside risks to US cred
n the long term chart below and all time high in shares outstanding looks cheap. Chart One shows hourly data of IEF (7.10y US Treasury ETF) and SPY (S&P500 ETF). Using 60 hourly data points, correlation has moved from around -80% a month ago to zero now. This means the volatility/leverage of risk parity por
2 mentions1 same-page
Page ?Same page
lphabet — $ 2 billion Chart Two shows Investment Grade ETF, LQD, is at the top of a long term range with shares outstanding around an all time high. Hans Mikkelsen noted on Friday in "Credit Market Strategist" with Japanese inflows into IG market already at max strength there are mostly downside risks to US cre
n the long term chart below and all time high in shares outstanding looks cheap. Chart One shows hourly data of IEF (7.10y US Treasury ETF) and SPY (S&P500 ETF). Using 60 hourly data points, correlation has moved from around -80% a month ago to zero now. This means the volatility/leverage of risk parity por
Sponsored
2 mentions1 same-page
Page ?Same page
t - $ 2 bill ion=/u> Chart Two shows Investment Grade ETF, L=D, is at the top of a long term range with shares outstanding around an all time high. Hans Mikkelsen noted on Friday in "Credit Market Strategist <http://rsch.baml.com/r?q=OaYw89Yo1IRsHX6GX=POlw&e=amanda.ens%40baml.com&h=QasuWw> " with Japanese inf
the long term chart below and all time high in shares outstanding looks cheap. Chart One shows hourly data of IEF (7-1=y US Treasury ETF) and SPY (S&P500 ETF). Using 60 hourly data points, =orrelation has moved from around -80% a month ago to zero now. This means the volatil=ty/leverage of risk parity po
2 mentions1 same-page
Page ?Same page
phabet — $ 2 billion Chart Two shows Investment Grade ETF, L=D, is at the top of a long term range with shares outstanding around an al= time high. Hans Mikkelsen noted on Friday in "Credit Market Strategist <http://rsch.baml.com/r?q=OaYw89Yo1lRsHX6GXUP0lw=amp;a=amanda.ens%40baml.com&h=QasuWw>" with Japanese
the long term chart below and all time=high in shares outstanding looks cheap. Chart One shows hourly data of IEF (7-1=y US Treasury ETF) and SPY (S&P500 ETF). Using 60 hourly data points, =orrelation has moved from around -80% a month ago to zero now. This means the volatility/leverage of risk parity po
2 mentions1 same-page
Page ?Same page
et — $ 2 billion=/u> Chart Two shows Investment Grade ETF, L=D, is at the top of a long term range with shares outstanding around an all time high. Hans Mikkelsen noted on Friday in "Credit Market Strategist <http://rsch.baml.com/r?q=OaYw89Yo11RsHX6GX=P0lw&e=amanda.ens%40baml.com&h=QasuWw> " with Japanese inf
the long term chart below and all time high in shares outstanding looks cheap. Chart One shows hourly data of IEF (7-1=y US Treasury ETF) and SPY (S&P500 ETF). Using 60 hourly data points, =orrelation has moved from around -80%a month ago to zero now. This means the volatil=ty/leverage of risk parity por
Sponsored
2 mentions1 same-page
Page ?Same page
phabet — $ 2 billion Chart Two shows Investment Grade ETF, LQD, is at the top of a long term range with shares outstanding around an all time high. Hans Mikkelsen noted on Friday in "Credit Market Strategist" with Japanese inflows into IG market already at max strength there are mostly downside risks to US cr
the long term chart below and all time high in shares outstanding looks cheap. Chart One shows hourly data of IEF (7-10y US Treasury ETF) and SPY (S&P500 ETF). Using 60 hourly data points, correlation has moved from around -80% a month ago to zero now. This means the volatility/leverage of risk parity po
2 mentions1 same-page
Page ?Same page
phabet — $ 2 billion Chart Two shows Investment Grade ETF, LQD, is at the top of a long term range with shares outstanding around an all time high. Hans Mikkelsen noted on Friday in "Credit Market Strategist <http://rsch.baml.com/r?q=0aYw89Yo1lRsHX6GXUP0lw&e=amanda.ens%40baml.com&h=QasuWw> " with Japanese inf
the long term chart below and all time high in shares outstanding looks cheap. Chart One shows hourly data of IEF (7.10y US Treasury ETF) and SPY (S&P500 ETF). Using 60 hourly data points, correlation has moved from around -80% a month ago to zero now. This means the volatility/leverage of risk parity po
2 mentions1 same-page
Page ?Same page
phabet — $ 2 billion Chart Two shows Investment Grade ETF, LQD, is at the top of a long term range with shares outstanding around an all time high. Hans Mikkelsen noted on Friday in "Credit Market Strategist chttp://rsch.baml.com/r?q=0aYw89Yo11RSHX6GXUP0Iw&e=amanda.ens%40baml.com&h=QasuWw> " with Japanese inf
the long term chart below and all time high in shares outstanding looks cheap. Chart One shows hourly data of IEF (7-10y US Treasury ETF) and SPY (S&P500 ETF). Using 60 hourly data points, correlation has moved from around -80% a month ago to zero now. This means the volatility/leverage of risk parity po
Sponsored
2 mentions1 same-page
Page ?Same page
t — $ 2 bill ion=/u> Chart Two shows Investment Grade ETF, L=D, is at the top of a long term range with shares outstanding around an all time high. Hans Mikkelsen noted on Friday in "Credit Market Strategist chttp://rsch.baml.com/r?q=OaYw89Yo11RsHX6GX=P0lw&e=amanda.ens%40baml.com&h=QasuWw> " with Japanese inf
the long term chart below and all time high in shares outstanding looks cheap. Chart One shows hourly data of IEF (7-1=y US Treasury ETF) and SPY (S&P500 ETF). Using 60 hourly data points, =orrelation has moved from around -80% a month ago to zero now. This means the volatil=ty/leverage of risk parity po
Sponsored
Mutual Connections (35)
Entities connected to both Hans Mikkelsen and S&P500 ETF
Marc Rich
PERSON12 w/ Hans·11 w/ S&P500
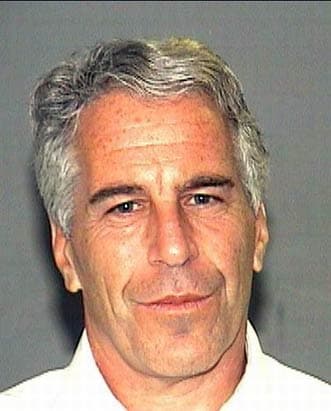
Jeffrey Epstein
PERSON11 w/ Hans·11 w/ S&P500
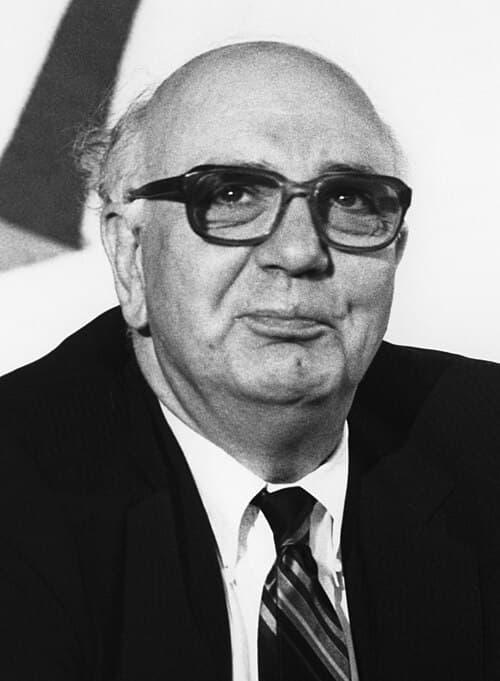
Paul Volcker
PERSON11 w/ Hans·11 w/ S&P500
Richard Kahn
PERSON11 w/ Hans·11 w/ S&P500
Bloomberg L.P.
ORGANIZATION11 w/ Hans·11 w/ S&P500
Frontier Communications
ORGANIZATION11 w/ Hans·11 w/ S&P500
Teva Pharma
ORGANIZATION11 w/ Hans·11 w/ S&P500
Chart One
ORGANIZATION11 w/ Hans·11 w/ S&P500
US Treasury ETF
ORGANIZATION11 w/ Hans·11 w/ S&P500
Investment Grade Supply
ORGANIZATION11 w/ Hans·11 w/ S&P500
Investment Grade ETF
ORGANIZATION11 w/ Hans·11 w/ S&P500
Spec Pharma
ORGANIZATION10 w/ Hans·10 w/ S&P500
Frontier Comm
ORGANIZATION10 w/ Hans·10 w/ S&P500
Allergan
LOCATION9 w/ Hans·9 w/ S&P500
AM
Amanda
PERSON8 w/ Hans·8 w/ S&P500
AE
Amanda Ens
PERSON7 w/ Hans·7 w/ S&P500
PR
Pfd Return
PERSON7 w/ Hans·7 w/ S&P500
Pierce, Fenner & Smith Incorporated
ORGANIZATION7 w/ Hans·5 w/ S&P500
Non-Farm Payrolls
ORGANIZATION6 w/ Hans·6 w/ S&P500
Outlook
ORGANIZATION6 w/ Hans·6 w/ S&P500